Milton: Fire Incidents, Massachusetts (MA)
Where are fire incidents reported in Milton, MA
Something went wrong! Please refresh the page.
| Fire incidents reported | |
|---|---|
| Sreet name | Count |
| BLUE HILL AVENUE | 1,030 |
| BRUSH HILL ROAD | 488 |
| CANTON AVENUE | 264 |
| CENTRE STREET | 248 |
| ADAMS STREET | 208 |
| RANDOLPH AVENUE | 188 |
| EDGE HILL ROAD | 152 |
| MILTON STREET | 122 |
| CAROLINE DRIVE | 120 |
| GRANITE AVENUE | 120 |
| BROOK ROAD | 114 |
| CURTIS ROAD | 110 |
| ROUTE 93 SOUTHBOUND | 76 |
| MILLER AVENUE | 68 |
| BLUE HILLS PARKWAY | 64 |
| ROUTE 93 NORTHBOUND | 64 |
| ELIOT STREET | 60 |
| HILLSIDE STREET | 60 |
| CENTRAL AVENUE | 58 |
| CHICKATAWBUT ROAD | 58 |
| ATHERTON STREET | 48 |
| HIGHLAND STREET | 46 |
| THATCHER STREET | 42 |
| HOUSTON AVENUE | 40 |
| GILE ROAD | 38 |
| UNQUITY ROAD | 34 |
| LYMAN ROAD | 32 |
| PLEASANT STREET | 32 |
| DECKER STREET | 28 |
| REEDSDALE ROAD | 28 |
2002 - 2018 National Fire Incident Reporting System (NFIRS) incidents
- Incident types reported to NFIRS in Milton, MA
- 10,71640.7%Rescue & EMS
- 3,53113.4%Hazardous Condition
- 3,12711.9%False Alarm
- 3,02911.5%Special Incident
- 2,99511.4%Fire
- 2,2878.7%Service Call
- 6172.3%Good Intent Call
- 300.1%Severe Weather
- Fire incident types reported to NFIRS in Milton, MA
- 1,90463.6%Structure Fires
- 66022.0%Outside Fires
- 30010.0%Mobile Property/Vehicle Fires
- 1314.4%Other
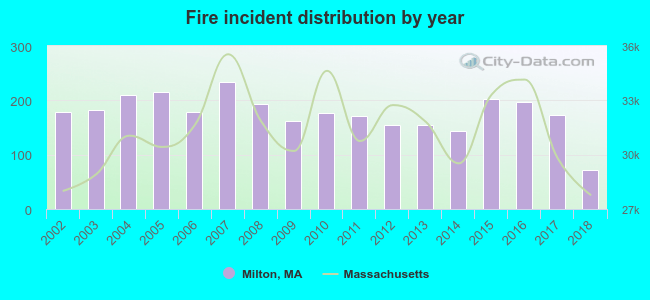 Based on the data from the years 2002 - 2018 the average number of fire incidents per year is 176. The highest number of reported fires - 233 took place in 2007, and the least - 72 in 2018. The data has a dropping trend.
The average number of yearly fire incidents per 10k residents in Milton, MA compared to nearest cities:
(Note: Based on data for the last 3 years, including only cities with population 5,000 and above)
| Milton: | 54.6 |
| Quincy: | 60.7 |
| Dedham: | 66.2 |
| Boston: | 83.7 |
| Braintree: | 24.7 |
| Randolph: | 60.2 |
| Brookline: | 72.0 |
| Canton: | 29.2 |
| Westwood: | 92.1 |
 The median response time based on all reported fire incidents is 3 minutes. This is lower than the Massachusetts median value.
The median response time in Milton, MA compared to nearest cities:
(Note: Based on data for all years, including only cities with at least 500 fire incidents)
| Milton: | 3 minutes |
| Quincy: | 3 minutes |
| Dedham: | 4 minutes |
| Boston: | 3 minutes |
| Braintree: | 3 minutes |
| Randolph: | 3 minutes |
| Brookline: | 3 minutes |
| Canton: | 5 minutes |
| Westwood: | 5 minutes |
 According to the reports from the years 2002 - 2018 the average number of fire-related fatalities per year is 1. The highest number of deaths - 4 took place in 2016, and the lowest - 0 in 2002. The data has a constant trend.
The average number of fatalities per 1,000 fire incidents is 3. This indicator was the highest - 20 in 2016, and the lowest 0 in 2002. The trend for fatalities per 1,000 incidents is decreasing. Compared to the Massachusetts value the number of fatalities per 1,000 incidents is much higher.
According to the reports from the years 2002 - 2018 the average number of fire-related fatalities per year is 1. The highest number of deaths - 4 took place in 2016, and the lowest - 0 in 2002. The data has a constant trend.
The average number of fatalities per 1,000 fire incidents is 3. This indicator was the highest - 20 in 2016, and the lowest 0 in 2002. The trend for fatalities per 1,000 incidents is decreasing. Compared to the Massachusetts value the number of fatalities per 1,000 incidents is much higher.
 According to the reports from the years 2002 - 2018 the average number of fire-related yearly casualties is 0. The highest number of reported casualties - 4 took place in 2002, and the lowest - 0 in 2004. The data has a declining trend.
The average number of injuries per 1,000 fires is 2. This indicator was the highest - 22 in 2002, and the lowest 0 in 2004. The trend for casualties per 1,000 fires is declining. Compared to the Massachusetts value the number of injuries per 1,000 fire incidents is much lower.
According to the reports from the years 2002 - 2018 the average number of fire-related yearly casualties is 0. The highest number of reported casualties - 4 took place in 2002, and the lowest - 0 in 2004. The data has a declining trend.
The average number of injuries per 1,000 fires is 2. This indicator was the highest - 22 in 2002, and the lowest 0 in 2004. The trend for casualties per 1,000 fires is declining. Compared to the Massachusetts value the number of injuries per 1,000 fire incidents is much lower.
 28.4% incidents where reported in the morning and 71.6% in the evening. The most fires (17.6%) took place on Sunday, and the least (12.7%) on Thursday.
 Based on the 2,995 fires from years 2002 - 2018 most fires (10.4%) took place during April, and the least (7.1%) in June.
 Out of all 26,347 cases reported during the years 2002 - 2018, the most belonged to the categories: Rescue & EMS (40.7%), Hazardous Condition (13.4%), and False Alarm (11.9%).
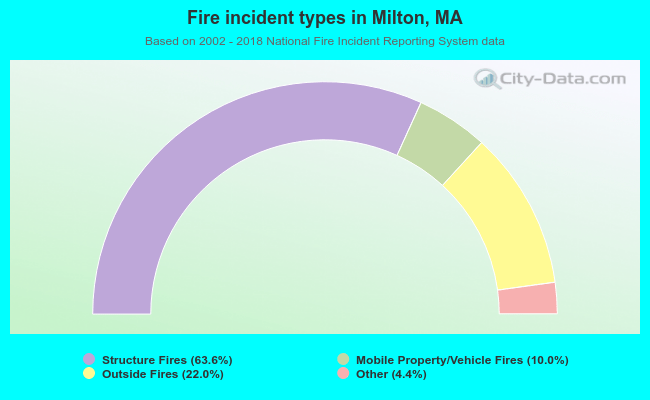 When looking into fire subcategories, the most reports belonged to: Structure Fires (63.6%), and Outside Fires (22.0%).