Modesto: Fire Incidents, California (CA)
Where are fire incidents reported in Modesto, CA
Something went wrong! Please refresh the page.
| Fire incidents reported | |
|---|---|
| Sreet name | Count |
| MC HENRY AVE | 626 |
| YOSEMITE BLVD | 518 |
| 9TH ST | 492 |
| OAKDALE RD | 420 |
| 7TH ST | 384 |
| COFFEE RD | 372 |
| 99 HWY | 362 |
| MCHENRY AVE | 340 |
| HATCH RD | 332 |
| ORANGEBURG AVE | 328 |
| STANDIFORD AVE | 316 |
| HWY 99 | 306 |
| CARPENTER RD | 284 |
| CROWS LANDING RD | 284 |
| SCENIC DR | 272 |
| TULLY RD | 248 |
| RIVER RD | 220 |
| DALE RD | 214 |
| SUTTER AVE | 208 |
| TIOGA DR | 208 |
| SANTA CRUZ AVE | 192 |
| LINCOLN AVE | 188 |
| FLOYD AVE | 184 |
| RUMBLE RD | 176 |
| KANSAS AVE | 174 |
| EMPIRE AVE | 172 |
| IMPERIAL AVE | 170 |
| NEECE DR | 166 |
| SISK RD | 164 |
| KERR AVE | 160 |
| Other | 5,509 |
2005 - 2018 National Fire Incident Reporting System (NFIRS) incidents
- Incident types reported to NFIRS in Modesto, CA
- 57,14658.8%Rescue & EMS
- 13,98914.4%Fire
- 11,37711.7%Good Intent Call
- 6,7456.9%Service Call
- 4,8755.0%Hazardous Condition
- 2,9283.0%False Alarm
- 1170.1%Special Incident
- Fire incident types reported to NFIRS in Modesto, CA
- 6,55046.8%Outside Fires
- 5,14736.8%Structure Fires
- 1,78912.8%Mobile Property/Vehicle Fires
- 5033.6%Other
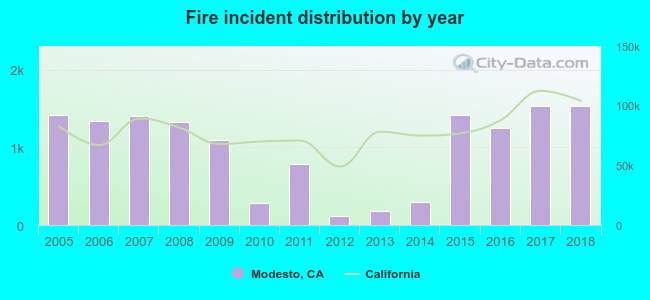 According to the data from the years 2005 - 2018 the average number of fires per year is 999. The highest number of reported fire incidents - 1,539 took place in 2018, and the least - 116 in 2012. The data has a rising trend.
The average number of yearly fire incidents per 10k residents in Modesto, CA compared to nearest cities:
(Note: Based on data for the last 3 years, including only cities with population 5,000 and above)
| Modesto: | 68.9 |
| Ceres: | 36.3 |
| Riverbank: | 32.8 |
| Salida: | 6.6 |
| Hughson: | 25.4 |
| Keyes: | 22.3 |
| Ripon: | 46.5 |
| Escalon: | 70.4 |
| Oakdale: | 39.2 |
 The median response time based on all reported fire incidents is 5 minutes. This is lower compared to the California median value.
The median response time in Modesto, CA compared to nearest cities:
(Note: Based on data for all years, including only cities with at least 500 fire incidents)
| Modesto: | 5 minutes |
| Ceres: | 5 minutes |
| Riverbank: | 6 minutes |
| Ripon: | 6 minutes |
| Oakdale: | 6 minutes |
| Turlock: | 5 minutes |
| Patterson: | 5 minutes |
| Manteca: | 5 minutes |
| Lathrop: | 6 minutes |
 According to the reports from the years 2005 - 2018 the average number of fire-related fatalities per year is 1. The highest number of deaths - 3 took place in 2015, and the lowest - 0 in 2008. The data has an increasing trend.
The average number of deaths per 1,000 fire incidents is 1. This indicator was the highest - 2 in 2015, and the lowest 0 in 2008. The trend for deaths per 1,000 incidents is growing. Compared to the state value the number of deaths per 1,000 incidents is lower.
According to the reports from the years 2005 - 2018 the average number of fire-related fatalities per year is 1. The highest number of deaths - 3 took place in 2015, and the lowest - 0 in 2008. The data has an increasing trend.
The average number of deaths per 1,000 fire incidents is 1. This indicator was the highest - 2 in 2015, and the lowest 0 in 2008. The trend for deaths per 1,000 incidents is growing. Compared to the state value the number of deaths per 1,000 incidents is lower.
 Based on the reports from the years 2005 - 2018 the average number of fire-related yearly casualties is 3. The highest number of casualties - 10 took place in 2006, and the lowest - 0 in 2012. The data has a dropping trend.
The average number of casualties per 1,000 fire incidents is 3. This indicator was the highest - 7 in 2006, and the lowest 0 in 2012. The trend for injuries per 1,000 fire incidents is decreasing. Compared to the California value the number of casualties per 1,000 incidents is lower.
Based on the reports from the years 2005 - 2018 the average number of fire-related yearly casualties is 3. The highest number of casualties - 10 took place in 2006, and the lowest - 0 in 2012. The data has a dropping trend.
The average number of casualties per 1,000 fire incidents is 3. This indicator was the highest - 7 in 2006, and the lowest 0 in 2012. The trend for injuries per 1,000 fire incidents is decreasing. Compared to the California value the number of casualties per 1,000 incidents is lower.
 37.9% incidents where reported in the morning and 62.1% in the evening. The most fires (15.3%) took place on Sunday, and the least (13.4%) on Thursday.
 According to the 13,989 fires from years 2005 - 2018 most fires (12.7%) took place during July, and the least (6.2%) in November.
 Out of all 97,199 cases reported during the years 2005 - 2018, the most belonged to the categories: Rescue & EMS (58.8%), Fire (14.4%), and Good Intent Call (11.7%).
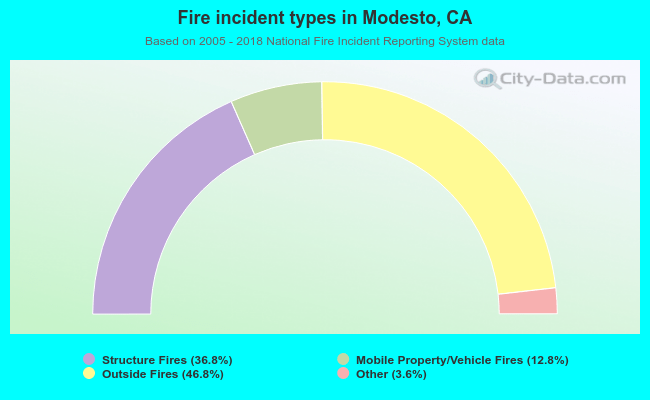 When looking into fire subcategories, the most reports belonged to: Outside Fires (46.8%), and Structure Fires (36.8%).