New Albany: Fire Incidents, Indiana (IN)
Where are fire incidents reported in New Albany, IN
Something went wrong! Please refresh the page.
| Fire incidents reported | |
|---|---|
| Sreet name | Count |
| SPRING ST | 170 |
| PAOLI PIKE | 164 |
| GRANTLINE RD | 136 |
| STATE ST | 110 |
| CHARLESTOWN RD | 104 |
| CULBERTSON AVE | 86 |
| OAK ST | 82 |
| SCRIBNER DR | 76 |
| MAIN ST | 74 |
| ELM ST | 72 |
| CHARLESTOWN ROAD RD | 64 |
| MARKET ST | 62 |
| WOLFE TR | 62 |
| ERNI AVE | 56 |
| BUDD ROAD RD | 50 |
| SILVER ST | 50 |
| SLATE RUN RD | 44 |
| VINCENNES ST | 44 |
| 8TH ST | 42 |
| CORYDON PIKE | 42 |
| EKIN AVE | 42 |
| MCDONALD AVE | 36 |
| 6 TH ST | 34 |
| BONO RD | 34 |
| 7 TH ST | 32 |
| VILLAGE DR | 32 |
| MILLS LN | 30 |
| GREEN VALLEY RD | 28 |
| HWY. 111 SOUTH HWY | 28 |
| MT. TABOR RD | 28 |
| Other | 630 |
2002 - 2018 National Fire Incident Reporting System (NFIRS) incidents
- Incident types reported to NFIRS in New Albany, IN
- 5,78146.0%Rescue & EMS
- 2,54420.3%Fire
- 2,31818.5%Hazardous Condition
- 7195.7%False Alarm
- 6805.4%Service Call
- 4783.8%Good Intent Call
- 150.1%Severe Weather
- Fire incident types reported to NFIRS in New Albany, IN
- 1,20547.4%Structure Fires
- 81432.0%Outside Fires
- 48118.9%Mobile Property/Vehicle Fires
- 441.7%Other
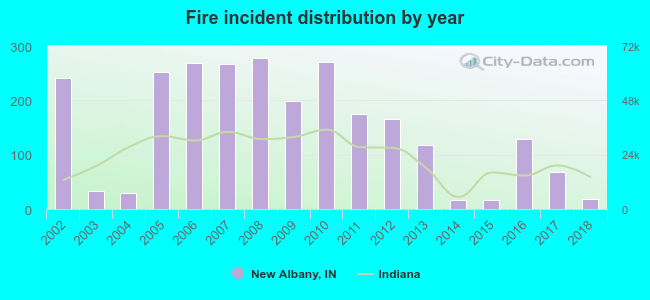 According to the data from the years 2002 - 2018 the average number of fire incidents per year is 150. The highest number of fires - 277 took place in 2008, and the least - 16 in 2014. The data has a decreasing trend.
The average number of yearly fire incidents per 10k residents in New Albany, IN compared to nearest cities:
(Note: Based on data for the last 3 years, including only cities with population 5,000 and above)
| New Albany: | 19.7 |
| Clarksville: | 2.3 |
| Jeffersonville: | 15.8 |
| Sellersburg: | 36.8 |
 The median response time based on all reported fire incidents is 4 minutes. This is lower than the Indiana median value.
The median response time in New Albany, IN compared to nearest cities:
(Note: Based on data for all years, including only cities with at least 500 fire incidents)
| New Albany: | 4 minutes |
| Clarksville: | 4 minutes |
| Jeffersonville: | 4 minutes |
| Sellersburg: | 6 minutes |
| Georgetown: | 6 minutes |
 According to the data from the years 2002 - 2018 the average number of fire-related fatalities per year is 0. The highest number of reported deaths - 2 took place in 2005, and the lowest - 0 in 2003. The data has a decreasing trend.
The average number of fatalities per 1,000 fires is 1. This indicator was the highest - 8 in 2005, and the lowest 0 in 2003. The trend for deaths per 1,000 fire incidents is decreasing. Compared to the state value the number of fatalities per 1,000 fire incidents is higher.
According to the data from the years 2002 - 2018 the average number of fire-related fatalities per year is 0. The highest number of reported deaths - 2 took place in 2005, and the lowest - 0 in 2003. The data has a decreasing trend.
The average number of fatalities per 1,000 fires is 1. This indicator was the highest - 8 in 2005, and the lowest 0 in 2003. The trend for deaths per 1,000 fire incidents is decreasing. Compared to the state value the number of fatalities per 1,000 fire incidents is higher.Deaths per 1,000 incidents in New Albany, IN compared to nearest cities:
(Note: Based on data for all years, including only cities with at least 2,500 fire incidents)
| New Albany: | 2.4 |
 According to the data from the years 2002 - 2018 the average number of fire-related yearly casualties is 5. The highest number of casualties - 12 took place in 2006, and the lowest - 0 in 2004. The data has a dropping trend.
The average number of injuries per 1,000 fire incidents is 24. This indicator was the highest - 54 in 2012, and the lowest 0 in 2004. The trend for casualties per 1,000 fire incidents is declining. Compared to the Indiana value the number of casualties per 1,000 fire incidents is much higher.
According to the data from the years 2002 - 2018 the average number of fire-related yearly casualties is 5. The highest number of casualties - 12 took place in 2006, and the lowest - 0 in 2004. The data has a dropping trend.
The average number of injuries per 1,000 fire incidents is 24. This indicator was the highest - 54 in 2012, and the lowest 0 in 2004. The trend for casualties per 1,000 fire incidents is declining. Compared to the Indiana value the number of casualties per 1,000 fire incidents is much higher.Casualties per 1,000 incidents in New Albany, IN compared to nearest cities:
(Note: Based on data for all years, including only cities with at least 500 fire incidents)
| New Albany: | 31.1 |
| Clarksville: | 5.2 |
| Jeffersonville: | 16.6 |
| Sellersburg: | 10.5 |
| Georgetown: | 1.3 |
 31.8% incidents where reported in the morning and 68.2% in the evening. The most fires (16.2%) took place on Saturday, and the least (12.3%) on Wednesday.
 Based on the 2,544 fire incident reports from years 2002 - 2018 most fires (9.8%) took place during July, and the least (6.1%) in December.
 Out of all 12,555 cases reported during the years 2002 - 2018, the most belonged to the categories: Rescue & EMS (46.0%), Fire (20.3%), and Hazardous Condition (18.5%).
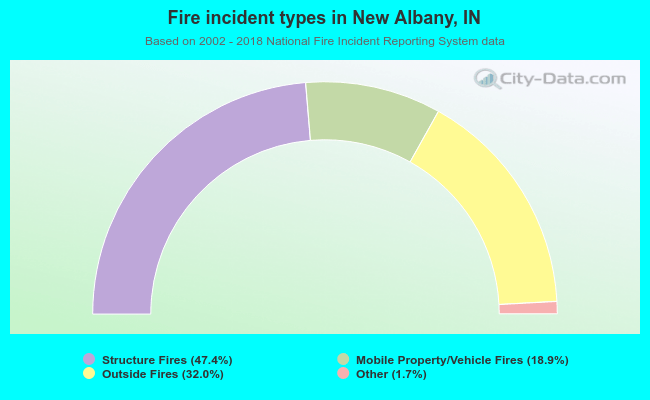 When looking into fire subcategories, the most incidents belonged to: Structure Fires (47.4%), and Outside Fires (32.0%).