New Castle: Fire Incidents, Delaware (DE)
Where are fire incidents reported in New Castle, DE
Something went wrong! Please refresh the page.
| Fire incidents reported | |
|---|---|
| Sreet name | Count |
| DUPONT HWY | 2,024 |
| CHRISTIANA RD | 478 |
| BASIN RD | 270 |
| NEW JERSEY AVE | 240 |
| DELAWARE ST | 186 |
| NEW CASTLE AVE | 166 |
| MOORES LN | 144 |
| CARVEL AVE | 142 |
| RIVER RD | 128 |
| HIGHLAND BLVD | 126 |
| AMSTEL DR | 122 |
| VILLAS DR | 98 |
| SOUTH ST | 96 |
| STONEBRIDGE BLVD | 94 |
| WILDEL AVE | 92 |
| HOLLAND CIR | 90 |
| PULASKI HWY | 86 |
| OLD AIRPORT RD | 84 |
| AIRPORT RD | 82 |
| KARLYN DR | 82 |
| OLD FORGE RD | 78 |
| CHURCHMANS RD | 70 |
| DUPONT HIGHWAY | 70 |
| CENTERPOINT BLVD | 66 |
| EDINBURGH DR | 64 |
| MEMORIAL DR | 64 |
| DUNSINANE DR | 62 |
| SURRY CT | 62 |
| BRIARCLIFF DR | 60 |
| WILTON BLVD | 60 |
| Other | 3,377 |
2002 - 2018 National Fire Incident Reporting System (NFIRS) incidents
- Incident types reported to NFIRS in New Castle, DE
- 8,86332.1%Fire
- 5,77620.9%Rescue & EMS
- 5,27219.1%Good Intent Call
- 4,67617.0%Hazardous Condition
- 2,1927.9%False Alarm
- 6832.5%Service Call
- 550.2%Overpressure Rupture
- 470.2%Special Incident
- Fire incident types reported to NFIRS in New Castle, DE
- 5,93366.9%Structure Fires
- 1,60918.2%Outside Fires
- 1,05911.9%Mobile Property/Vehicle Fires
- 2623.0%Other
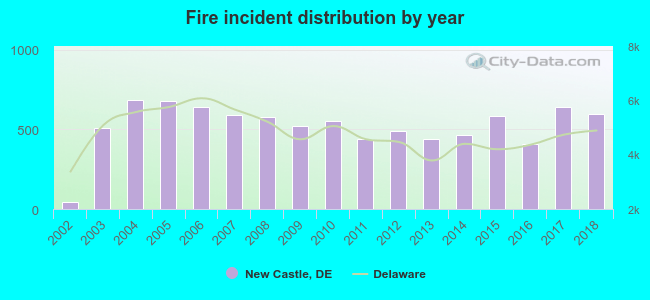 According to the data from the years 2002 - 2018 the average number of fires per year is 521. The highest number of fires - 683 took place in 2004, and the least - 45 in 2002. The data has a growing trend.
The average number of yearly fire incidents per 10k residents in New Castle, DE compared to nearest cities:
(Note: Based on data for the last 3 years, including only cities with population 5,000 and above)
| New Castle: | 1,020.0 |
| Wilmington Manor: | 3.8 |
| Elsmere: | 19.0 |
| Wilmington: | 159.3 |
| Bear: | 92.9 |
| Pike Creek: | 3.2 |
| Newark: | 202.9 |
| Glasgow: | 1.4 |
| Hockessin: | 23.4 |
 The median response time based on all reported fire incidents is 7 minutes. This is similar to the Delaware median value.
The median response time in New Castle, DE compared to nearest cities:
(Note: Based on data for all years, including only cities with at least 500 fire incidents)
| New Castle: | 7 minutes |
| Wilmington: | 6 minutes |
| Delaware City: | 8 minutes |
| Bear: | 9 minutes |
| Newark: | 8 minutes |
| Hockessin: | 8 minutes |
| Claymont: | 6 minutes |
| Middletown: | 8 minutes |
| Townsend: | 9 minutes |
 According to the data from the years 2002 - 2018 the average number of fire-related yearly deaths is 1. The highest number of deaths - 5 took place in 2007, and the lowest - 0 in 2002. The data has an increasing trend.
The average number of deaths per 1,000 fire incidents is 1. This indicator was the highest - 8 in 2007, and the lowest 0 in 2002. The trend for fatalities per 1,000 fires is rising. Compared to the state value the number of fatalities per 1,000 fire incidents is higher.
According to the data from the years 2002 - 2018 the average number of fire-related yearly deaths is 1. The highest number of deaths - 5 took place in 2007, and the lowest - 0 in 2002. The data has an increasing trend.
The average number of deaths per 1,000 fire incidents is 1. This indicator was the highest - 8 in 2007, and the lowest 0 in 2002. The trend for fatalities per 1,000 fires is rising. Compared to the state value the number of fatalities per 1,000 fire incidents is higher.Deaths per 1,000 incidents in New Castle, DE compared to nearest cities:
(Note: Based on data for all years, including only cities with at least 2,500 fire incidents)
| New Castle: | 1.7 |
| Wilmington: | 0.6 |
| Bear: | 0.4 |
| Newark: | 1.2 |
| Middletown: | 1.1 |
 According to the reports from the years 2002 - 2018 the average number of fire-related casualties per year is 2. The highest number of reported casualties - 8 took place in 2017, and the lowest - 0 in 2002. The data has a constant trend.
The average number of injuries per 1,000 fires is 3. This indicator was the highest - 13 in 2017, and the lowest 0 in 2002. The trend for injuries per 1,000 incidents is constant. Compared to the state value the number of injuries per 1,000 incidents is similar.
According to the reports from the years 2002 - 2018 the average number of fire-related casualties per year is 2. The highest number of reported casualties - 8 took place in 2017, and the lowest - 0 in 2002. The data has a constant trend.
The average number of injuries per 1,000 fires is 3. This indicator was the highest - 13 in 2017, and the lowest 0 in 2002. The trend for injuries per 1,000 incidents is constant. Compared to the state value the number of injuries per 1,000 incidents is similar.Casualties per 1,000 incidents in New Castle, DE compared to nearest cities:
(Note: Based on data for all years, including only cities with at least 500 fire incidents)
| New Castle: | 3.4 |
| Wilmington: | 4.5 |
| Delaware City: | 6.2 |
| Bear: | 6.0 |
| Newark: | 2.2 |
| Hockessin: | 1.3 |
| Claymont: | 6.4 |
| Middletown: | 3.8 |
| Townsend: | 4.1 |
 33.3% incidents where reported in the morning and 66.7% in the evening. The most fires (15.5%) took place on Sunday, and the least (13.1%) on Thursday.
 According to the 8,863 incident reports from years 2002 - 2018 most fires (10.0%) took place during March, and the least (6.9%) in February.
 Out of all 27,581 cases reported during the years 2002 - 2018, the most belonged to the categories: Fire (32.1%), Rescue & EMS (20.9%), and Good Intent Call (19.1%).
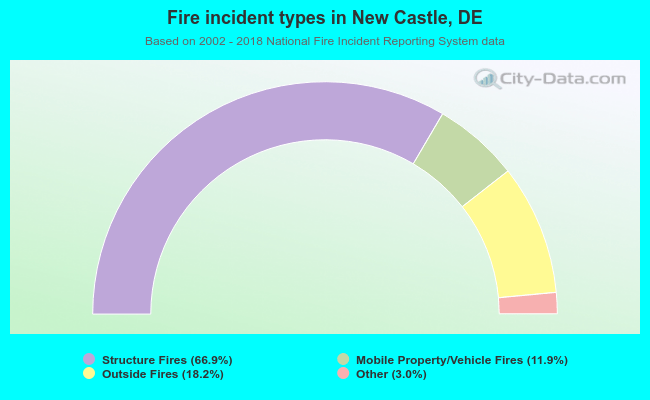 When looking into fire subcategories, the most incidents belonged to: Structure Fires (66.9%), and Outside Fires (18.2%).