New Harmony: Fire Incidents, Indiana (IN)
Where are fire incidents reported in New Harmony, IN
Something went wrong! Please refresh the page.
|
| |||||||||||||||||||||||||||||||||||||||||||||||||||||||||||||||||||||||||||||||||||||||||||||||||||||||||||||
2002 - 2017 National Fire Incident Reporting System (NFIRS) incidents
- Incident types reported to NFIRS in New Harmony, IN
- 23748.1%Rescue & EMS
- 17234.9%Fire
- 5110.3%Hazardous Condition
- 142.8%False Alarm
- 91.8%Good Intent Call
- 71.4%Service Call
- 20.4%Severe Weather
- 10.2%Overpressure Rupture
- Fire incident types reported to NFIRS in New Harmony, IN
- 8851.2%Outside Fires
- 5330.8%Structure Fires
- 169.3%Mobile Property/Vehicle Fires
- 158.7%Other
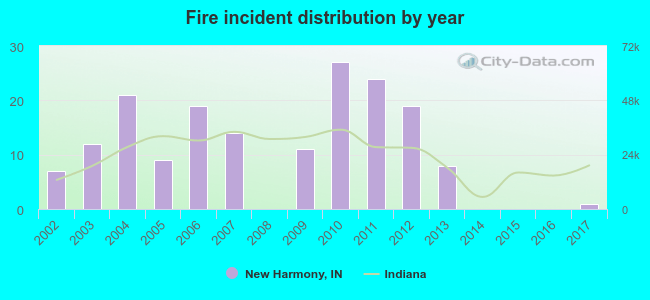 Based on the data from the years 2002 - 2017 the average number of fire incidents per year is 11. The highest number of reported fire incidents - 27 took place in 2010, and the least - 0 in 2008. The data has a dropping trend.
 30.8% incidents where reported in the morning and 69.2% in the evening. The most fires (21.5%) took place on Sunday, and the least (8.7%) on Wednesday.
 According to the 172 reports from years 2002 - 2017 most fires (12.8%) took place during March, and the least (5.8%) in January.
 Out of all 493 cases reported during the years 2002 - 2017, the most belonged to the categories: Rescue & EMS (48.1%), Fire (34.9%), and Hazardous Condition (10.3%).
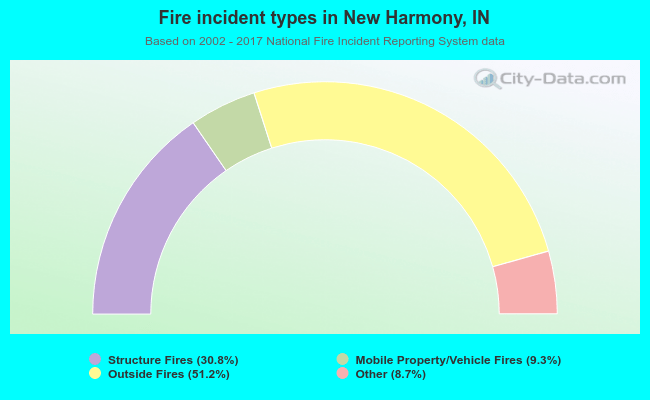 When looking into fire subcategories, the most incidents belonged to: Outside Fires (51.2%), and Structure Fires (30.8%).