New Iberia: Fire Incidents, Louisiana (LA)
Where are fire incidents reported in New Iberia, LA
Something went wrong! Please refresh the page.
| Fire incidents reported | |
|---|---|
| Sreet name | Count |
| ADMIRAL DOYLE DR | 358 |
| MAIN ST | 174 |
| CENTER ST | 100 |
| HIGHWAY 90 | 96 |
| OLD SPANISH TRL | 82 |
| SAINT PETER ST | 72 |
| HWY 90 | 70 |
| COTEAU RD | 68 |
| PERSHING ST | 68 |
| HIGHWAY 14 | 66 |
| MISSISSIPPI ST | 66 |
| DASPIT RD | 64 |
| LOREAUVILLE RD | 64 |
| DEARE ST | 62 |
| WASHINGTON ST | 60 |
| FIELD ST | 56 |
| HWY 14 | 56 |
| JANE ST | 56 |
| DALE ST | 54 |
| IBERIA ST | 54 |
| NORTHSIDE RD | 54 |
| CORINNE ST | 52 |
| LEWIS AV | 52 |
| MYRTIS ST | 50 |
| WEEKS ST | 48 |
| PARKVIEW DR | 46 |
| ANN ST | 44 |
| JEFFERSON TERRACE BLVD | 44 |
| LAKE PEIGNEUR RD | 44 |
| YVONNE ST | 44 |
| Other | 1,654 |
2002 - 2018 National Fire Incident Reporting System (NFIRS) incidents
- Incident types reported to NFIRS in New Iberia, LA
- 4,12826.3%Rescue & EMS
- 3,87824.7%Fire
- 2,92718.7%Hazardous Condition
- 2,69017.1%Good Intent Call
- 1,60410.2%False Alarm
- 3872.5%Service Call
- 470.3%Overpressure Rupture
- 230.1%Severe Weather
- Fire incident types reported to NFIRS in New Iberia, LA
- 1,66843.0%Outside Fires
- 1,41036.4%Structure Fires
- 67717.5%Mobile Property/Vehicle Fires
- 1233.2%Other
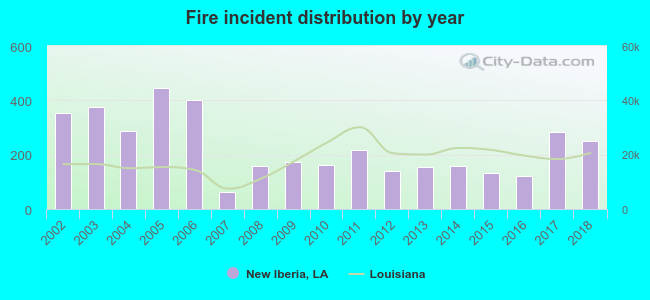 Based on the data from the years 2002 - 2018 the average number of fires per year is 228. The highest number of reported fires - 445 took place in 2005, and the least - 61 in 2007. The data has a decreasing trend.
The average number of yearly fire incidents per 10k residents in New Iberia, LA compared to nearest cities:
(Note: Based on data for the last 3 years, including only cities with population 5,000 and above)
| New Iberia: | 71.1 |
| Jeanerette: | 144.7 |
| Youngsville: | 83.6 |
| Broussard: | 79.8 |
| Abbeville: | 97.2 |
| Lafayette: | 36.2 |
| Breaux Bridge: | 124.5 |
| Scott: | 94.7 |
| Franklin: | 76.9 |
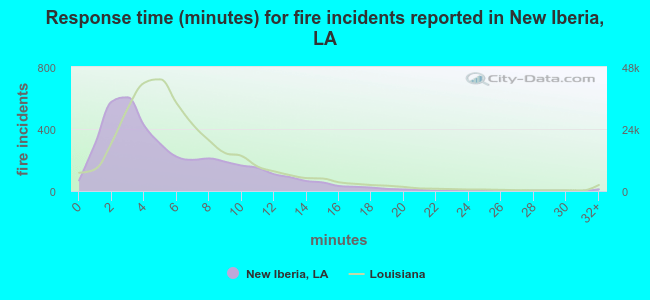 The median response time based on all reported fire incidents is 4 minutes. This is lower compared to the state median value.
The median response time in New Iberia, LA compared to nearest cities:
(Note: Based on data for all years, including only cities with at least 500 fire incidents)
| New Iberia: | 4 minutes |
| Jeanerette: | 7 minutes |
| Youngsville: | 7 minutes |
| Broussard: | 7 minutes |
| Erath: | 9 minutes |
| Abbeville: | 5 minutes |
| Lafayette: | 5 minutes |
| Breaux Bridge: | 11 minutes |
| Scott: | 9 minutes |
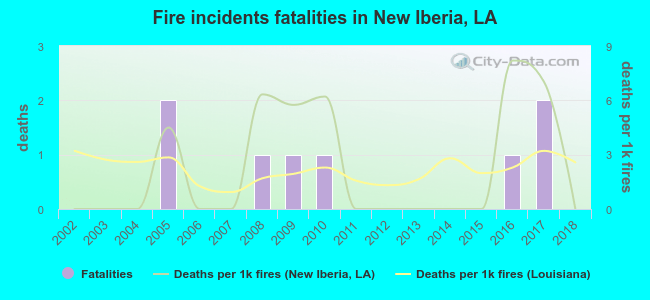 According to the reports from the years 2002 - 2018 the average number of fire-related fatalities per year is 0. The highest number of reported deaths - 2 took place in 2005, and the lowest - 0 in 2002. The data has a constant trend.
The average number of fatalities per 1,000 fire incidents is 2. This indicator was the highest - 8 in 2016, and the lowest 0 in 2002. The trend for fatalities per 1,000 fire incidents is decreasing. Compared to the state value the number of deaths per 1,000 incidents is about the same.
According to the reports from the years 2002 - 2018 the average number of fire-related fatalities per year is 0. The highest number of reported deaths - 2 took place in 2005, and the lowest - 0 in 2002. The data has a constant trend.
The average number of fatalities per 1,000 fire incidents is 2. This indicator was the highest - 8 in 2016, and the lowest 0 in 2002. The trend for fatalities per 1,000 fire incidents is decreasing. Compared to the state value the number of deaths per 1,000 incidents is about the same.
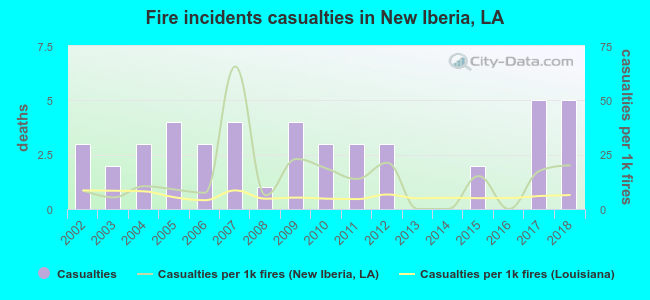 Based on the reports from the years 2002 - 2018 the average number of fire-related casualties per year is 3. The highest number of reported injuries - 5 took place in 2017, and the lowest - 0 in 2013. The data has a growing trend.
The average number of injuries per 1,000 fires is 14. This indicator was the highest - 66 in 2007, and the lowest 0 in 2013. The trend for injuries per 1,000 fires is increasing. Compared to the state value the number of injuries per 1,000 incidents is much higher.
Based on the reports from the years 2002 - 2018 the average number of fire-related casualties per year is 3. The highest number of reported injuries - 5 took place in 2017, and the lowest - 0 in 2013. The data has a growing trend.
The average number of injuries per 1,000 fires is 14. This indicator was the highest - 66 in 2007, and the lowest 0 in 2013. The trend for injuries per 1,000 fires is increasing. Compared to the state value the number of injuries per 1,000 incidents is much higher.Casualties per 1,000 incidents in New Iberia, LA compared to nearest cities:
(Note: Based on data for all years, including only cities with at least 500 fire incidents)
| New Iberia: | 11.6 |
| Jeanerette: | 5.6 |
| Youngsville: | 3.6 |
| Broussard: | 5.3 |
| Erath: | 0.0 |
| Abbeville: | 6.8 |
| Lafayette: | 13.5 |
| Breaux Bridge: | 1.8 |
| Scott: | 4.3 |
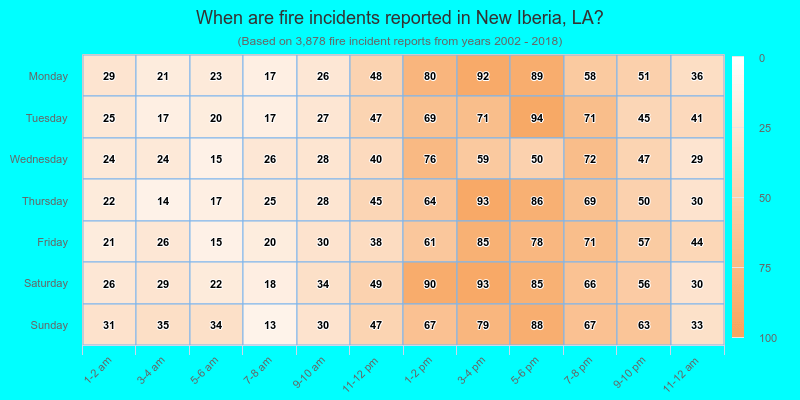
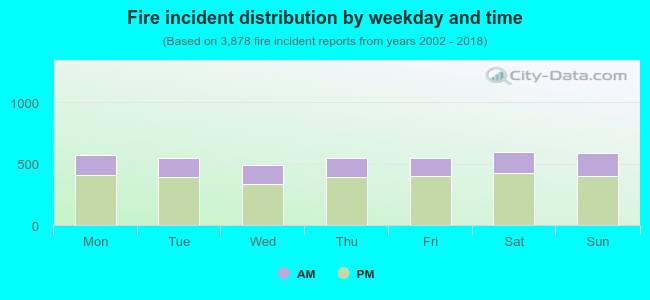 29.5% incidents where reported in the morning and 70.5% in the evening. The most fires (15.4%) took place on Saturday, and the least (12.6%) on Wednesday.
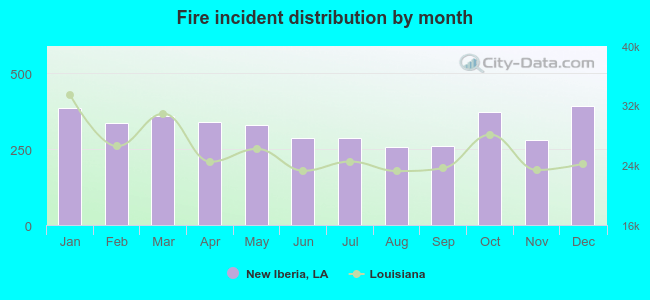 Based on the 3,878 fire incident reports from years 2002 - 2018 most fires (10.1%) took place during December, and the least (6.6%) in August.
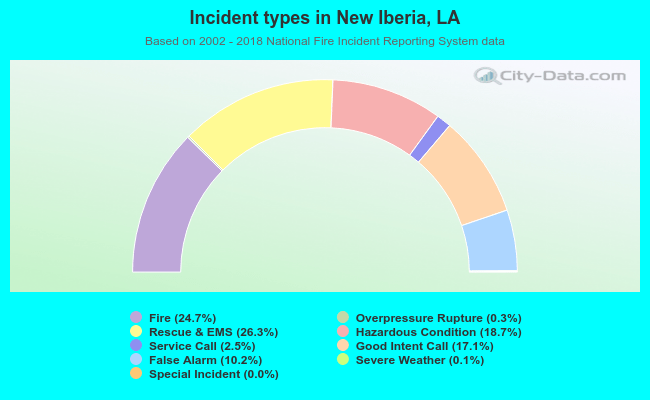 Out of all 15,689 cases reported during the years 2002 - 2018, the most belonged to the categories: Rescue & EMS (26.3%), Fire (24.7%), and Hazardous Condition (18.7%).
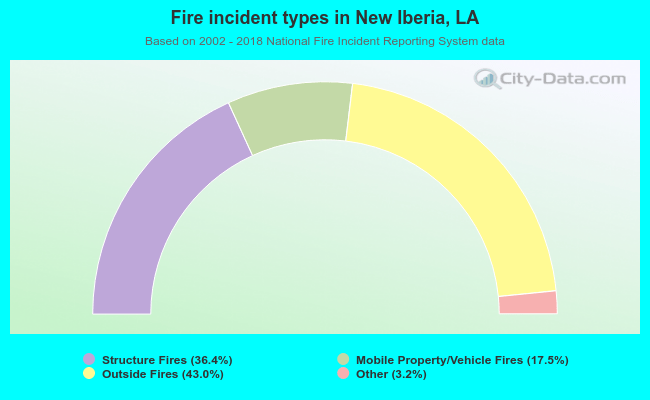 When looking into fire subcategories, the most reports belonged to: Outside Fires (43.0%), and Structure Fires (36.4%).