Newark: Fire Incidents, California (CA)
Where are fire incidents reported in Newark, CA
Something went wrong! Please refresh the page.
| Fire incidents reported | |
|---|---|
| Sreet name | Count |
| CHERRY ST | 38 |
| THORNTON | 32 |
| NEWARK | 30 |
| SYCAMORE ST | 28 |
| CEDAR | 26 |
| CEDAR BL | 26 |
| CHERRY ST | 26 |
| NEWARK BL | 24 |
| HALEY ST | 22 |
| JARVIS | 22 |
| MOWRY AV | 22 |
| THORNTON AV | 22 |
| CEDAR BL | 20 |
| NEWARK BLVD | 20 |
| MAGNOLIA ST | 18 |
| NEWARK BL | 18 |
| THORNTON AV | 16 |
| JOAQUIN MURIETA | 14 |
| NEWPARK MALL | 14 |
| THORNTON AVE | 14 |
| BIRCH ST | 12 |
| CEDAR BLVD | 12 |
| ELM ST | 12 |
| MOWRY | 12 |
| CENTRAL | 10 |
| CENTRAL AV | 10 |
| DUMBARTON CT | 10 |
| EUREKA DR | 10 |
| HALEY ST | 10 |
| JOAQUIN MURIETA AVE | 10 |
| Other | 88 |
2002 - 2018 National Fire Incident Reporting System (NFIRS) incidents
- Incident types reported to NFIRS in Newark, CA
- 7,13566.7%Rescue & EMS
- 9609.0%False Alarm
- 8137.6%Good Intent Call
- 6486.1%Fire
- 6155.7%Service Call
- 4874.6%Hazardous Condition
- 270.3%Special Incident
- Fire incident types reported to NFIRS in Newark, CA
- 27242.0%Structure Fires
- 26240.4%Outside Fires
- 9715.0%Mobile Property/Vehicle Fires
- 172.6%Other
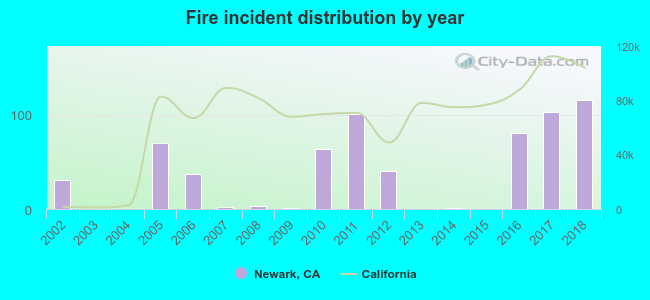 According to the data from the years 2002 - 2018 the average number of fires per year is 38. The highest number of reported fires - 115 took place in 2018, and the least - 0 in 2003. The data has a rising trend.
The average number of yearly fire incidents per 10k residents in Newark, CA compared to nearest cities:
(Note: Based on data for the last 3 years, including only cities with population 5,000 and above)
| Newark: | 22.2 |
| Fremont: | 19.8 |
| Union City: | 18.2 |
| East Palo Alto: | 20.3 |
| Hayward: | 3.3 |
| Palo Alto: | 18.5 |
| Menlo Park: | 21.6 |
| Mountain View: | 5.5 |
| Milpitas: | 12.6 |
 The median response time based on all reported fire incidents is 4 minutes. This is lower compared to the California median value.
The median response time in Newark, CA compared to nearest cities:
(Note: Based on data for all years, including only cities with at least 500 fire incidents)
| Newark: | 4 minutes |
| Fremont: | 5 minutes |
| Union City: | 5 minutes |
| East Palo Alto: | 4 minutes |
| Hayward: | 4 minutes |
| Palo Alto: | 6 minutes |
| Menlo Park: | 4 minutes |
| Mountain View: | 5 minutes |
| Milpitas: | 5 minutes |
 29.9% incidents where reported in the morning and 70.1% in the evening. The most fires (15.6%) took place on Friday, and the least (11.6%) on Thursday.
 According to the 648 reports from years 2002 - 2018 most fires (19.6%) took place during July, and the least (4.9%) in December.
 Out of all 10,696 cases reported during the years 2002 - 2018, the most belonged to the categories: Rescue & EMS (66.7%), False Alarm (9.0%), and Good Intent Call (7.6%).
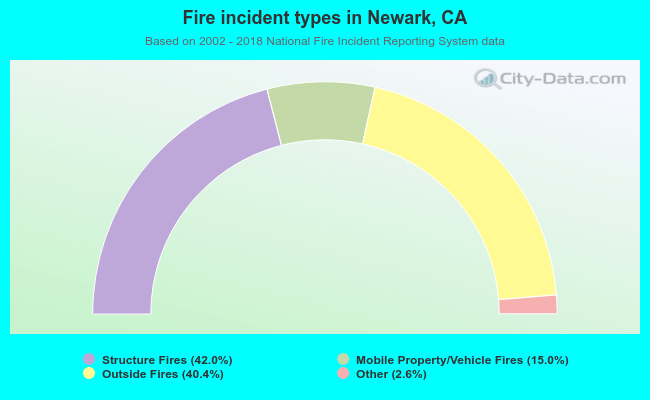 When looking into fire subcategories, the most incidents belonged to: Structure Fires (42.0%), and Outside Fires (40.4%).