| Fire incidents reported |
|---|
| Sreet name | Count |
|---|
| FOURTH ST | 16 | | NEWPORT ROAD RD | 16 | | MIDDLE RIDGE ROAD RD | 14 | | RTE 22322 HWY | 10 | | THIRD ST | 10 | | FRONT ST | 8 | | NEWPORT ROAD 2151227 | 6 | | RTE 22-322 HWY | 6 | | SECOND ST | 6 | | SECOND STREET | 6 | | WALNUT ST | 6 | | 4TH ST | 4 | | BUFFALO TRCE | 4 | | CAMPBELL DRIVE OR LANE | 4 | | FOURTH STREET | 4 | | FOURTH STREET S 700 BLOCK | 4 | | FREEDOM STREET | 4 | | FREEDOM STREET RD | 4 | | HICKORY RIDGE ROAD RD | 4 | | HOMINY RIDGE ROAD RD | 4 | | JUNIATA PARKWAY RD | 4 | | LOWER BAILEY ROAD RD | 4 | | MAHANOY VALLEY ROAD RD | 4 | | MARKET ST | 4 | | MARKET STREET | 4 |
| | | Fire incidents reported |
|---|
| Sreet name | Count |
|---|
| MIDDLE RIDGE RD | 4 | | MIDDLE RIDGE ROAD 5100 | 4 | | MULBERRY ST | 4 | | NEWPORT ROAD 1734-189 | 4 | | OAK HALL ROAD RD | 4 | | OAK HALL SCHOOL ROAD RD | 4 | | PINTAIL DRVIE RD | 4 | | SHORT CUT ROAD RD | 4 | | SIXTH ST | 4 | | WINDING HILL RD | 4 | | 10 GREENWOOD LANE | 2 | | 4TH STREET | 2 | | 4TH STREET EXTENDED RD | 2 | | ACKER LOOP ROAD RD | 2 | | ASPER HILL RD | 2 | | ASPER HILL ROAD RD | 2 | | BAILEY RUN TRL PARK PARK | 2 | | BEERS AVE RD | 2 | | BEERS AVE | 2 | | BEERS AVENUE 130 BLK | 2 | | BOOTS HOLLOW RD | 2 | | BUFFALO CREEK ROAD RD | 2 | | BUFFALO TRACE | 2 | | BURD RD | 2 | | BURD ROAD | 2 |
|
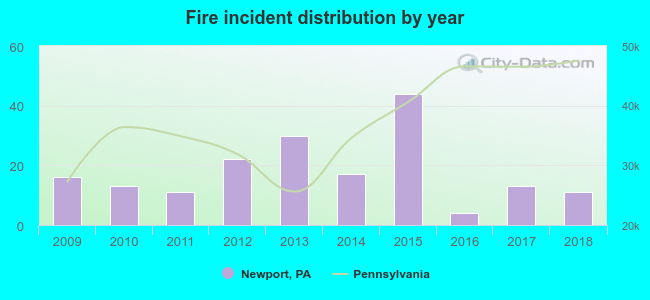 According to the data from the years 2009 - 2018 the average number of fires per year is 18. The highest number of reported fire incidents - 44 took place in 2015, and the least - 4 in 2016. The data has a declining trend.
 37.6% incidents where reported in the morning and 62.4% in the evening. The most fires (16.6%) took place on Friday, and the least (12.7%) on Saturday.
 Based on the 181 fire incidents from years 2009 - 2018 most fires (16.6%) took place during April, and the least (3.9%) in August.
 Out of all 405 cases reported during the years 2009 - 2018, the most belonged to the categories: Fire (44.7%), Overpressure Rupture (16.8%), and Rescue & EMS (15.1%).
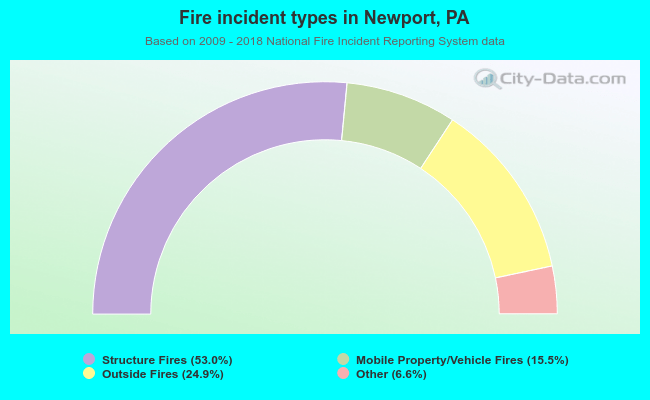 When looking into fire subcategories, the most reports belonged to: Structure Fires (53.0%), and Outside Fires (24.9%).