North Lauderdale: Fire Incidents, Florida (FL)
Where are fire incidents reported in North Lauderdale, FL
Something went wrong! Please refresh the page.
| Fire incidents reported | |
|---|---|
| Sreet name | Count |
| MCNAB RD | 142 |
| SR 7 | 136 |
| KIMBERLY BLVD | 124 |
| 10TH CT | 72 |
| SOUTHGATE BLVD | 72 |
| 81ST AVE | 70 |
| 22ND ST | 66 |
| 10TH ST | 60 |
| AVON LN | 60 |
| HAMPTONS BLVD | 58 |
| 12TH ST | 44 |
| 5TH ST | 44 |
| HAMPTON BLVD | 44 |
| ROCK ISLAND RD | 44 |
| SUSSEX DR | 42 |
| BAILEY RD | 38 |
| SAN REMO BLVD | 38 |
| 17TH ST | 34 |
| 8TH CT | 34 |
| COVE LAKE RD | 32 |
| 8TH ST | 28 |
| 20TH ST | 24 |
| 7TH PL | 24 |
| TAM | 24 |
| SEAVIEW | 22 |
| 24TH ST | 20 |
| 81ST TER | 20 |
| BELMONT LN | 20 |
| 11TH CT | 18 |
| 19TH ST | 18 |
2003 - 2018 National Fire Incident Reporting System (NFIRS) incidents
- Incident types reported to NFIRS in North Lauderdale, FL
- 14,43465.5%Rescue & EMS
- 2,81612.8%Good Intent Call
- 1,4196.4%Service Call
- 1,3005.9%Fire
- 1,0714.9%False Alarm
- 9534.3%Hazardous Condition
- Fire incident types reported to NFIRS in North Lauderdale, FL
- 71755.2%Structure Fires
- 27120.8%Outside Fires
- 23117.8%Mobile Property/Vehicle Fires
- 816.2%Other
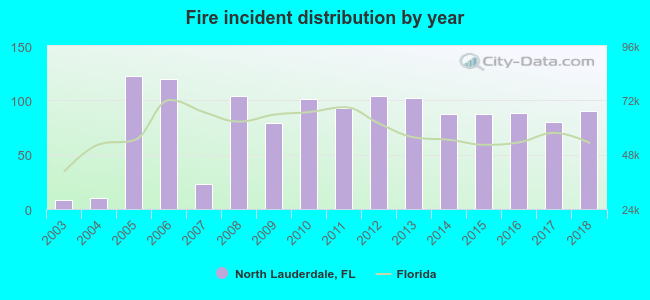 Based on the data from the years 2003 - 2018 the average number of fire incidents per year is 81. The highest number of fires - 122 took place in 2005, and the least - 8 in 2003. The data has an increasing trend.
The average number of yearly fire incidents per 10k residents in North Lauderdale, FL compared to nearest cities:
(Note: Based on data for the last 3 years, including only cities with population 5,000 and above)
| North Lauderdale: | 19.9 |
| Tamarac: | 11.5 |
| Margate: | 17.2 |
| Lauderdale Lakes: | 22.5 |
| Lauderhill: | 24.5 |
| Coral Springs: | 3.5 |
| Coconut Creek: | 13.4 |
| Sunrise: | 16.0 |
| Oakland Park: | 32.1 |
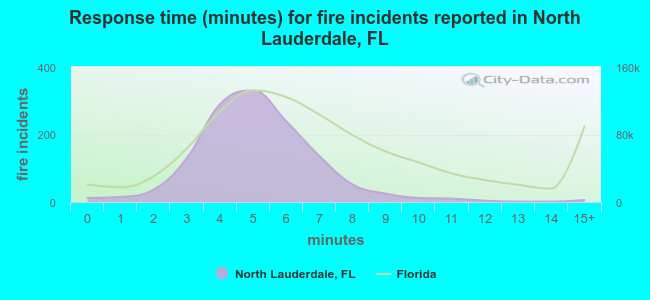 The median response time based on all reported fire incidents is 5 minutes. This is lower compared to the Florida median value.
The median response time in North Lauderdale, FL compared to nearest cities:
(Note: Based on data for all years, including only cities with at least 500 fire incidents)
| North Lauderdale: | 5 minutes |
| Tamarac: | 6 minutes |
| Margate: | 5 minutes |
| Lauderdale Lakes: | 6 minutes |
| Lauderhill: | 6 minutes |
| Coral Springs: | 5 minutes |
| Coconut Creek: | 6 minutes |
| Sunrise: | 6 minutes |
| Oakland Park: | 5 minutes |
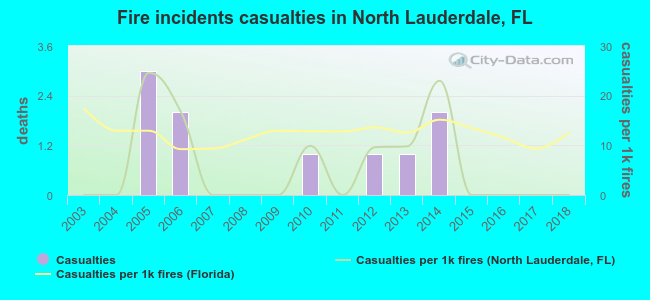 Based on the reports from the years 2003 - 2018 the average number of fire-related casualties per year is 1. The highest number of casualties - 3 took place in 2005, and the lowest - 0 in 2003. The data has a constant trend.
The average number of casualties per 1,000 fire incidents is 6. This indicator was the highest - 25 in 2005, and the lowest 0 in 2003. The trend for injuries per 1,000 fire incidents is constant. Compared to the state value the number of casualties per 1,000 fires is lower.
Based on the reports from the years 2003 - 2018 the average number of fire-related casualties per year is 1. The highest number of casualties - 3 took place in 2005, and the lowest - 0 in 2003. The data has a constant trend.
The average number of casualties per 1,000 fire incidents is 6. This indicator was the highest - 25 in 2005, and the lowest 0 in 2003. The trend for injuries per 1,000 fire incidents is constant. Compared to the state value the number of casualties per 1,000 fires is lower.Casualties per 1,000 incidents in North Lauderdale, FL compared to nearest cities:
(Note: Based on data for all years, including only cities with at least 500 fire incidents)
| North Lauderdale: | 7.7 |
| Tamarac: | 7.1 |
| Margate: | 25.8 |
| Lauderdale Lakes: | 31.3 |
| Lauderhill: | 39.2 |
| Coral Springs: | 16.9 |
| Coconut Creek: | 23.3 |
| Sunrise: | 32.6 |
| Oakland Park: | 0.5 |
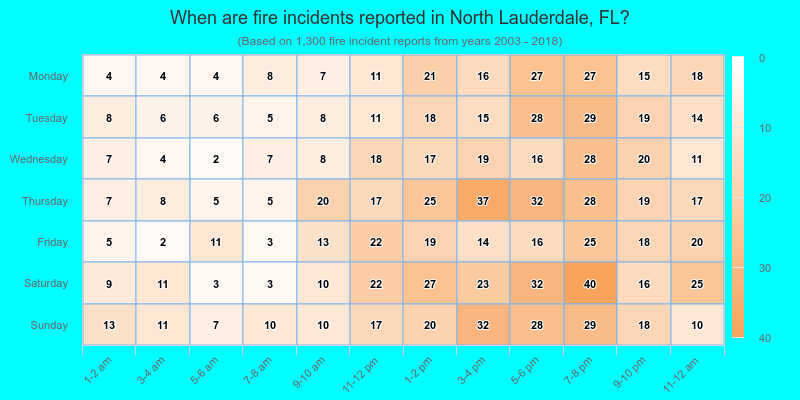
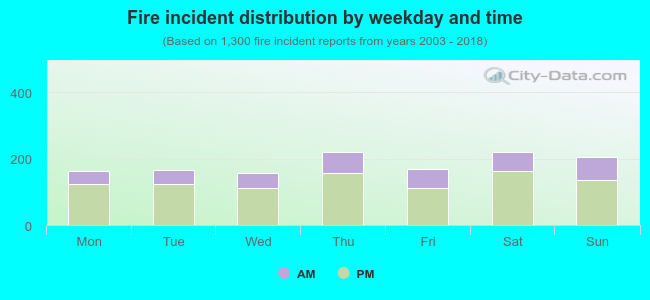 28.6% incidents where reported in the morning and 71.4% in the evening. The most fires (17.0%) took place on Saturday, and the least (12.1%) on Wednesday.
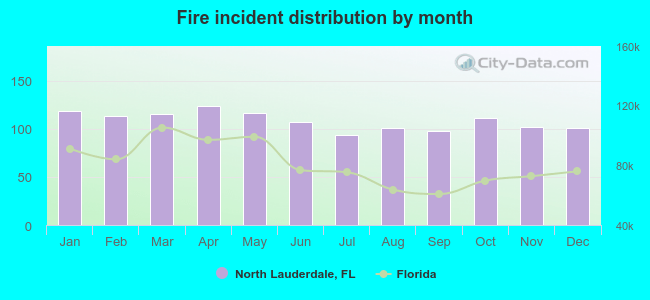 According to the 1,300 fires from years 2003 - 2018 most fires (9.5%) took place during April, and the least (7.2%) in July.
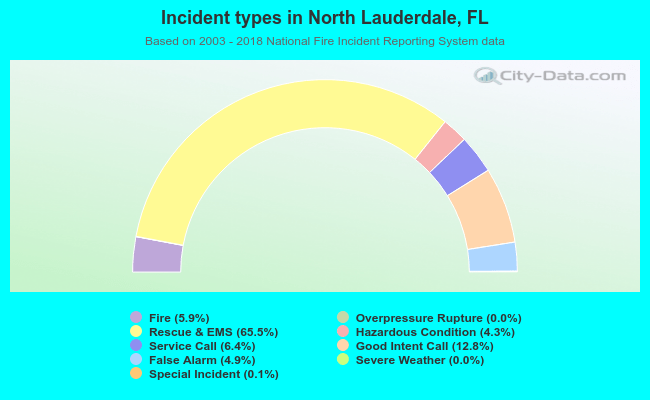 Out of all 22,022 cases reported during the years 2003 - 2018, the most belonged to the categories: Rescue & EMS (65.5%), Good Intent Call (12.8%), and Service Call (6.4%).
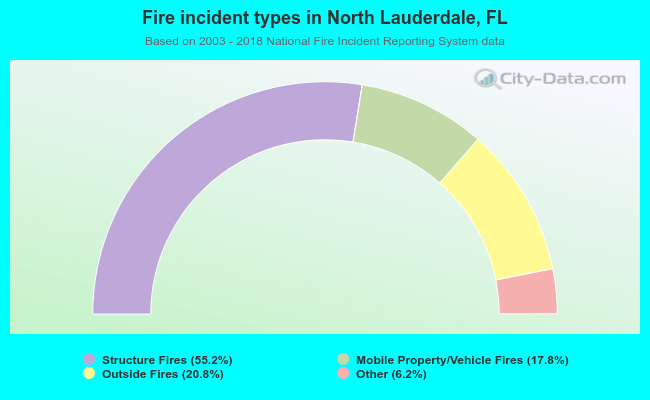 When looking into fire subcategories, the most reports belonged to: Structure Fires (55.2%), and Outside Fires (20.8%).