North Olmsted: Fire Incidents, Ohio (OH)
Where are fire incidents reported in North Olmsted, OH
Something went wrong! Please refresh the page.
| Fire incidents reported | |
|---|---|
| Sreet name | Count |
| LORAIN RD | 756 |
| COUNTRY CLUB BLVD | 280 |
| COLUMBIA RD | 210 |
| BROOKPARK RD | 180 |
| I480 HWY | 130 |
| GREAT NORTHERN MALL | 120 |
| GREAT NORTHERN BLVD | 112 |
| GREAT NORTHERN PLZ | 102 |
| FAIRVIEW PARK, CITY OF | 88 |
| CLAGUE RD | 74 |
| WESTLAKE, CITY OF | 72 |
| BUTTERNUT RIDGE RD | 52 |
| PORTER RD | 44 |
| DOVER CENTER RD | 40 |
| NORTH RIDGEVILLE, CITY OF | 40 |
| OLMSTED TWP., CITY OF | 40 |
| BARTON RD | 36 |
| DAVID DR | 34 |
| BROOKPARK RD EXT | 28 |
| LORAIN | 28 |
| BRENDAN LA | 26 |
| DELMERE DR | 26 |
| MAPLE RIDGE RD | 26 |
| OLMSTED TWP CITY OF | 26 |
| FAIRVIEW PARK CITY OF | 24 |
| STEARNS RD | 24 |
| BURNS RD | 22 |
| CANTERBURY RD | 22 |
| CLARESHIRE DR | 22 |
| ELM RD | 22 |
2002 - 2018 National Fire Incident Reporting System (NFIRS) incidents
- Incident types reported to NFIRS in North Olmsted, OH
- 2,36423.3%Rescue & EMS
- 2,26322.3%Fire
- 2,19221.6%Hazardous Condition
- 1,34013.2%False Alarm
- 1,13411.2%Service Call
- 7227.1%Good Intent Call
- 460.5%Special Incident
- 340.3%Overpressure Rupture
- 320.3%Severe Weather
- Fire incident types reported to NFIRS in North Olmsted, OH
- 1,31658.2%Structure Fires
- 65629.0%Outside Fires
- 27912.3%Mobile Property/Vehicle Fires
- 120.5%Other
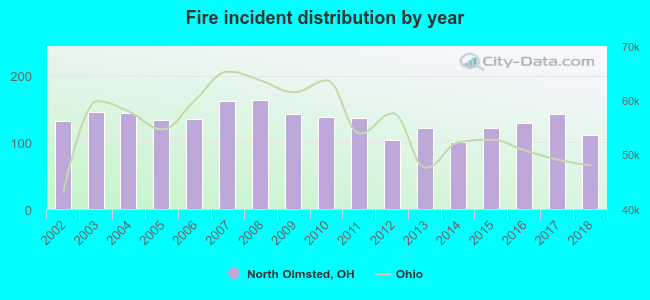 According to the data from the years 2002 - 2018 the average number of fires per year is 133. The highest number of reported fires - 163 took place in 2008, and the least - 100 in 2014. The data has a declining trend.
The average number of yearly fire incidents per 10k residents in North Olmsted, OH compared to nearest cities:
(Note: Based on data for the last 3 years, including only cities with population 5,000 and above)
| North Olmsted: | 39.7 |
| Westlake: | 30.5 |
| Olmsted Falls: | 40.9 |
| Fairview Park: | 33.2 |
| Berea: | 43.9 |
| Bay Village: | 21.8 |
| North Ridgeville: | 19.5 |
| Brook Park: | 25.1 |
| Rocky River: | 30.0 |
 The median response time based on all reported fire incidents is 4 minutes. This is lower compared to the Ohio median value.
The median response time in North Olmsted, OH compared to nearest cities:
(Note: Based on data for all years, including only cities with at least 500 fire incidents)
| North Olmsted: | 4 minutes |
| Westlake: | 6 minutes |
| Fairview Park: | 5 minutes |
| Berea: | 5 minutes |
| Bay Village: | 5 minutes |
| North Ridgeville: | 6 minutes |
| Brook Park: | 5 minutes |
| Rocky River: | 5 minutes |
| Avon: | 7 minutes |
 According to the reports from the years 2002 - 2018 the average number of fire-related yearly deaths is 0. The highest number of deaths - 3 took place in 2015, and the lowest - 0 in 2002. The data has a constant trend.
 Based on the data from the years 2002 - 2018 the average number of fire-related yearly casualties is 1. The highest number of injuries - 9 took place in 2011, and the lowest - 0 in 2006. The data has a dropping trend.
The average number of casualties per 1,000 fire incidents is 10. This indicator was the highest - 66 in 2011, and the lowest 0 in 2006. The trend for casualties per 1,000 fire incidents is dropping. Compared to the Ohio value the number of casualties per 1,000 fire incidents is lower.
Based on the data from the years 2002 - 2018 the average number of fire-related yearly casualties is 1. The highest number of injuries - 9 took place in 2011, and the lowest - 0 in 2006. The data has a dropping trend.
The average number of casualties per 1,000 fire incidents is 10. This indicator was the highest - 66 in 2011, and the lowest 0 in 2006. The trend for casualties per 1,000 fire incidents is dropping. Compared to the Ohio value the number of casualties per 1,000 fire incidents is lower.Casualties per 1,000 incidents in North Olmsted, OH compared to nearest cities:
(Note: Based on data for all years, including only cities with at least 500 fire incidents)
| North Olmsted: | 10.2 |
| Westlake: | 27.5 |
| Fairview Park: | 7.1 |
| Berea: | 15.4 |
| Bay Village: | 9.0 |
| North Ridgeville: | 11.0 |
| Brook Park: | 25.0 |
| Rocky River: | 13.3 |
| Avon: | 16.3 |
 30.3% incidents where reported in the morning and 69.7% in the evening. The most fires (15.9%) took place on Sunday, and the least (12.8%) on Wednesday.
 Based on the 2,263 fire incidents from years 2002 - 2018 most fires (12.3%) took place during June, and the least (6.2%) in October.
 Out of all 10,127 cases reported during the years 2002 - 2018, the most belonged to the categories: Rescue & EMS (23.3%), Fire (22.3%), and Hazardous Condition (21.6%).
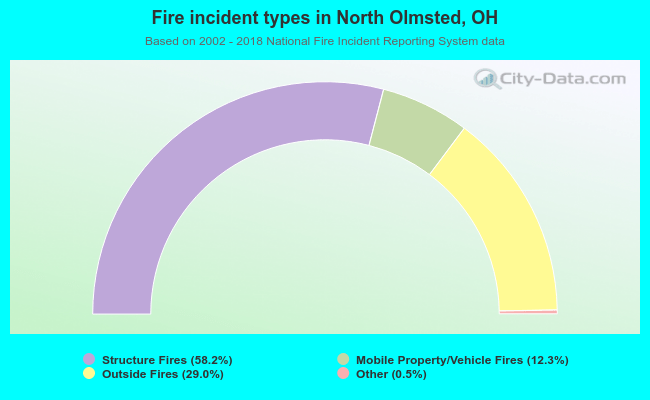 When looking into fire subcategories, the most incidents belonged to: Structure Fires (58.2%), and Outside Fires (29.0%).