Oak Lawn: Fire Incidents, Illinois (IL)
Where are fire incidents reported in Oak Lawn, IL
Something went wrong! Please refresh the page.
| Fire incidents reported | |
|---|---|
| Sreet name | Count |
| 95TH ST | 464 |
| CICERO AVE | 374 |
| RIDGELAND AVE | 122 |
| 99TH ST | 116 |
| SOUTHWEST HWY | 84 |
| 109TH ST | 74 |
| 93RD ST | 72 |
| KOLMAR AVE | 64 |
| PULASKI RD | 64 |
| CENTRAL AVE | 62 |
| KEELER AVE | 60 |
| KARLOV AVE | 58 |
| 110TH ST | 56 |
| 88TH PL | 56 |
| MAYFIELD AVE | 56 |
| 111TH ST | 54 |
| 92ND ST | 54 |
| AUSTIN AVE | 52 |
| 51ST AVE | 50 |
| 103RD ST | 48 |
| 52ND AVE | 48 |
| 87TH ST | 48 |
| 98TH ST | 46 |
| KEATING AVE | 44 |
| 95TH | 42 |
| COLUMBUS DR | 42 |
| KOMENSKY AVE | 42 |
| TRIPP AVE | 42 |
| 90TH ST | 40 |
| KEDVALE AVE | 40 |
| Other | 351 |
2002 - 2018 National Fire Incident Reporting System (NFIRS) incidents
- Incident types reported to NFIRS in Oak Lawn, IL
- 24,51258.8%Rescue & EMS
- 4,84411.6%Service Call
- 3,9029.4%Hazardous Condition
- 3,2207.7%False Alarm
- 2,8256.8%Fire
- 2,2565.4%Good Intent Call
- 920.2%Overpressure Rupture
- Fire incident types reported to NFIRS in Oak Lawn, IL
- 1,52554.0%Structure Fires
- 84629.9%Outside Fires
- 36312.8%Mobile Property/Vehicle Fires
- 913.2%Other
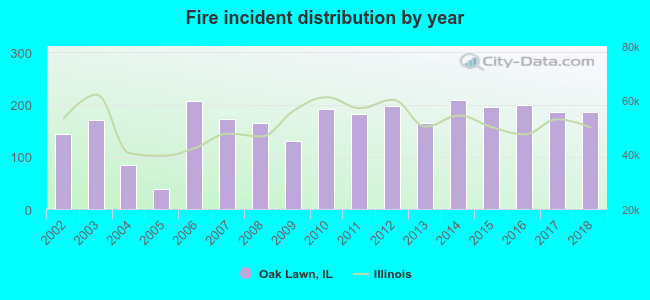 Based on the data from the years 2002 - 2018 the average number of fire incidents per year is 166. The highest number of fire incidents - 208 took place in 2014, and the least - 39 in 2005. The data has a rising trend.
The average number of yearly fire incidents per 10k residents in Oak Lawn, IL compared to nearest cities:
(Note: Based on data for the last 3 years, including only cities with population 5,000 and above)
| Oak Lawn: | 33.4 |
| Chicago Ridge: | 54.5 |
| Burbank: | 31.9 |
| Evergreen Park: | 38.0 |
| Worth: | 50.1 |
| Alsip: | 49.4 |
| Bridgeview: | 83.7 |
| Hickory Hills: | 40.0 |
| Palos Hills: | 37.6 |
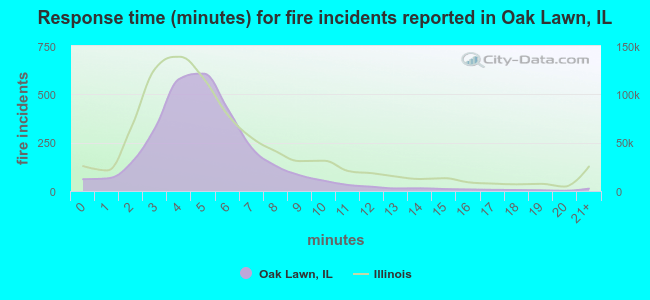 The median response time based on all reported fire incidents is 5 minutes. This is comparable to the Illinois median value.
The median response time in Oak Lawn, IL compared to nearest cities:
(Note: Based on data for all years, including only cities with at least 500 fire incidents)
| Oak Lawn: | 5 minutes |
| Chicago Ridge: | 5 minutes |
| Burbank: | 4 minutes |
| Evergreen Park: | 4 minutes |
| Worth: | 4 minutes |
| Alsip: | 5 minutes |
| Bridgeview: | 5 minutes |
| Hickory Hills: | 4 minutes |
| Palos Hills: | 4 minutes |
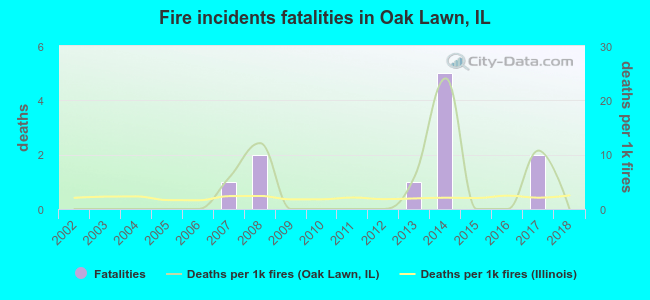 According to the data from the years 2002 - 2018 the average number of fire-related fatalities per year is 1. The highest number of reported deaths - 5 took place in 2014, and the lowest - 0 in 2002. The data has a constant trend.
The average number of deaths per 1,000 fire incidents is 3. This indicator was the highest - 24 in 2014, and the lowest 0 in 2002. The trend for fatalities per 1,000 fire incidents is constant. Compared to the Illinois value the number of fatalities per 1,000 fires is higher.
According to the data from the years 2002 - 2018 the average number of fire-related fatalities per year is 1. The highest number of reported deaths - 5 took place in 2014, and the lowest - 0 in 2002. The data has a constant trend.
The average number of deaths per 1,000 fire incidents is 3. This indicator was the highest - 24 in 2014, and the lowest 0 in 2002. The trend for fatalities per 1,000 fire incidents is constant. Compared to the Illinois value the number of fatalities per 1,000 fires is higher.
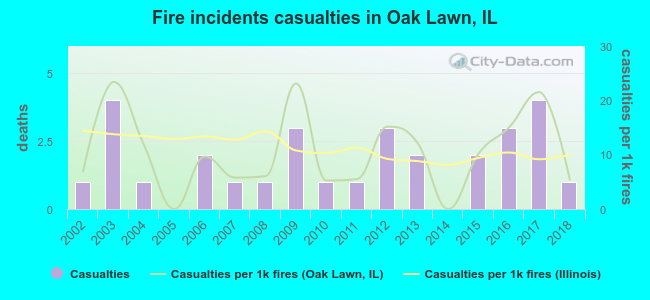 According to the data from the years 2002 - 2018 the average number of fire-related casualties per year is 2. The highest number of reported injuries - 4 took place in 2003, and the lowest - 0 in 2005. The data has a constant trend.
The average number of injuries per 1,000 fires is 10. This indicator was the highest - 23 in 2003, and the lowest 0 in 2005. The trend for injuries per 1,000 incidents is dropping. Compared to the state value the number of casualties per 1,000 incidents is about the same.
According to the data from the years 2002 - 2018 the average number of fire-related casualties per year is 2. The highest number of reported injuries - 4 took place in 2003, and the lowest - 0 in 2005. The data has a constant trend.
The average number of injuries per 1,000 fires is 10. This indicator was the highest - 23 in 2003, and the lowest 0 in 2005. The trend for injuries per 1,000 incidents is dropping. Compared to the state value the number of casualties per 1,000 incidents is about the same.Casualties per 1,000 incidents in Oak Lawn, IL compared to nearest cities:
(Note: Based on data for all years, including only cities with at least 500 fire incidents)
| Oak Lawn: | 10.6 |
| Chicago Ridge: | 6.1 |
| Burbank: | 18.2 |
| Evergreen Park: | 7.5 |
| Worth: | 3.8 |
| Alsip: | 15.0 |
| Bridgeview: | 13.5 |
| Hickory Hills: | 21.9 |
| Palos Hills: | 12.1 |
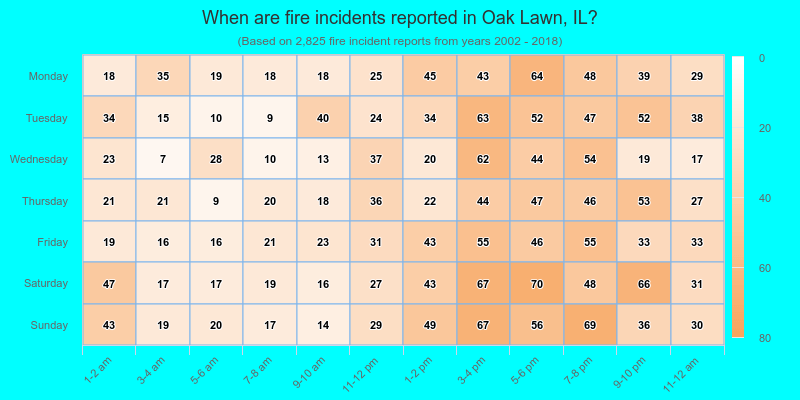
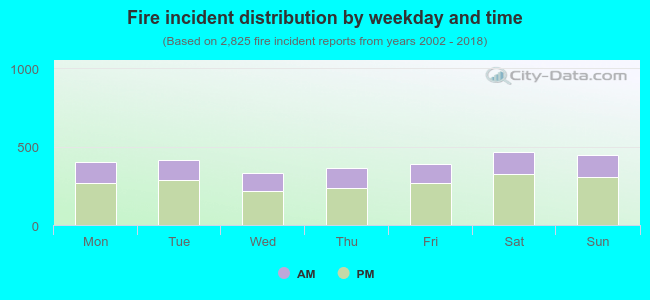 32.5% incidents where reported in the morning and 67.5% in the evening. The most fires (16.6%) took place on Saturday, and the least (11.8%) on Wednesday.
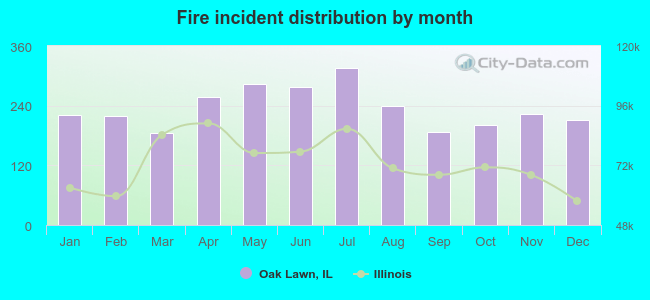 According to the 2,825 reports from years 2002 - 2018 most fires (11.2%) took place during July, and the least (6.5%) in March.
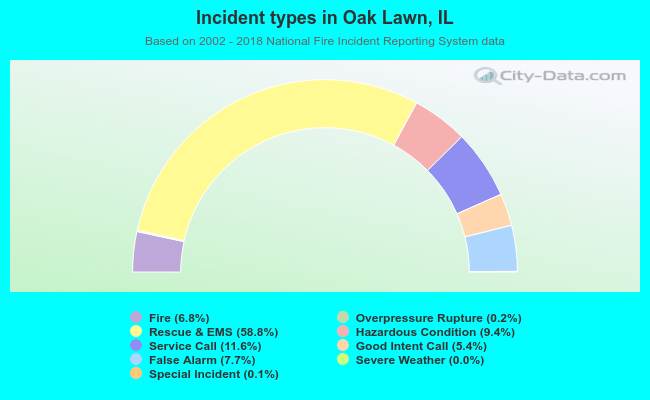 Out of all 41,680 cases reported during the years 2002 - 2018, the most belonged to the categories: Rescue & EMS (58.8%), Service Call (11.6%), and Hazardous Condition (9.4%).
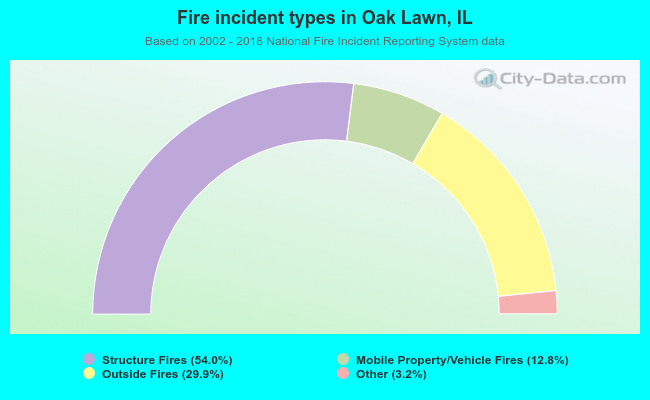 When looking into fire subcategories, the most incidents belonged to: Structure Fires (54.0%), and Outside Fires (29.9%).