Ocean City: Fire Incidents, New Jersey (NJ)
Where are fire incidents reported in Ocean City, NJ
Something went wrong! Please refresh the page.
| Fire incidents reported | |
|---|---|
| Sreet name | Count |
| WESLEY AVE | 166 |
| WEST AVE | 166 |
| ASBURY AVE | 146 |
| CENTRAL AVE | 128 |
| BAY AVE | 122 |
| BOARDWALK | 118 |
| 8TH ST | 86 |
| HAVEN AVE | 82 |
| SIMPSON AVE | 68 |
| 9TH ST | 58 |
| OCEAN AVE | 58 |
| 12TH ST | 40 |
| ATLANTIC AVE | 36 |
| 10TH ST | 34 |
| 11TH ST | 32 |
| 7TH ST | 22 |
| CENTRAL | 22 |
| MOORLYN TER | 22 |
| 13TH ST | 18 |
| 34TH ST | 16 |
| ATLANTIC BLVD | 16 |
| 14TH ST | 14 |
| FLINDERS REEF | 14 |
| PARK PL | 14 |
| PLYMOUTH PL | 14 |
| LITTLE ATLANTIC AVE | 12 |
| PLEASURE AVE | 12 |
| ST CHARLES PL | 12 |
| 16TH ST | 10 |
| 32ND ST | 10 |
2004 - 2018 National Fire Incident Reporting System (NFIRS) incidents
- Incident types reported to NFIRS in Ocean City, NJ
- 3,37832.3%Rescue & EMS
- 3,02828.9%Hazardous Condition
- 1,58015.1%False Alarm
- 1,07610.3%Fire
- 1,06810.2%Service Call
- 2512.4%Good Intent Call
- 550.5%Special Incident
- 180.2%Severe Weather
- Fire incident types reported to NFIRS in Ocean City, NJ
- 59355.1%Structure Fires
- 38535.8%Outside Fires
- 686.3%Mobile Property/Vehicle Fires
- 302.8%Other
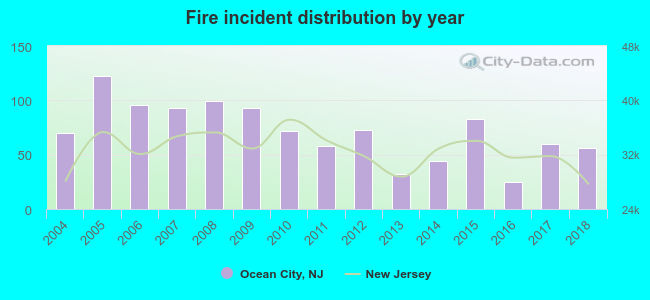 According to the data from the years 2004 - 2018 the average number of fire incidents per year is 72. The highest number of reported fire incidents - 122 took place in 2005, and the least - 25 in 2016. The data has a dropping trend.
The average number of yearly fire incidents per 10k residents in Ocean City, NJ compared to nearest cities:
(Note: Based on data for the last 3 years, including only cities with population 5,000 and above)
| Ocean City: | 41.3 |
| Somers Point: | 43.1 |
| Linwood: | 12.3 |
| Margate City: | 34.2 |
| Northfield: | 31.0 |
| Pleasantville: | 46.4 |
| Atlantic City: | 61.0 |
| Absecon: | 17.1 |
| Pomona: | 23.9 |
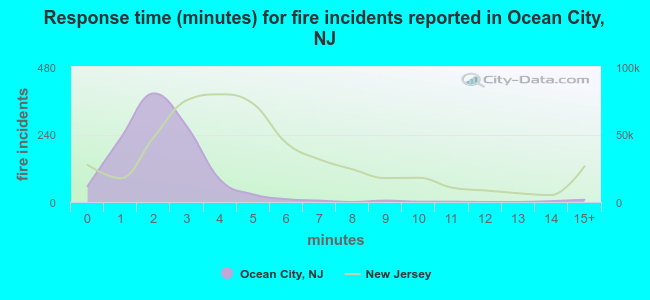 The median response time based on all reported fire incidents is 2 minutes. This is much lower compared to the state median value.
The median response time in Ocean City, NJ compared to nearest cities:
(Note: Based on data for all years, including only cities with at least 500 fire incidents)
| Ocean City: | 2 minutes |
| Somers Point: | 6 minutes |
| Pleasantville: | 2 minutes |
| Atlantic City: | 5 minutes |
| Brigantine: | 3 minutes |
| Mays Landing: | 6 minutes |
| Cape May Court House: | 5 minutes |
| Wildwood: | 2 minutes |
| Rio Grande: | 3 minutes |
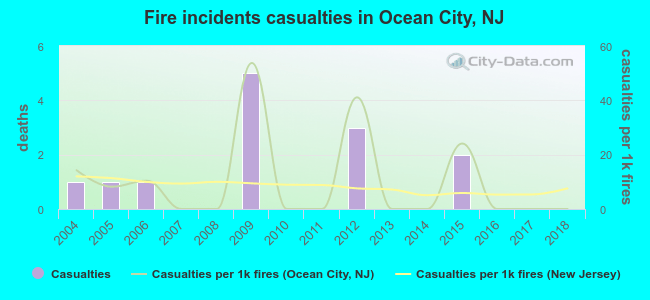 According to the reports from the years 2004 - 2018 the average number of fire-related casualties per year is 1. The highest number of reported injuries - 5 took place in 2009, and the lowest - 0 in 2007. The data has a declining trend.
The average number of injuries per 1,000 fires is 10. This indicator was the highest - 54 in 2009, and the lowest 0 in 2007. The trend for injuries per 1,000 fires is declining. Compared to the New Jersey value the number of injuries per 1,000 fires is higher.
According to the reports from the years 2004 - 2018 the average number of fire-related casualties per year is 1. The highest number of reported injuries - 5 took place in 2009, and the lowest - 0 in 2007. The data has a declining trend.
The average number of injuries per 1,000 fires is 10. This indicator was the highest - 54 in 2009, and the lowest 0 in 2007. The trend for injuries per 1,000 fires is declining. Compared to the New Jersey value the number of injuries per 1,000 fires is higher.Casualties per 1,000 incidents in Ocean City, NJ compared to nearest cities:
(Note: Based on data for all years, including only cities with at least 500 fire incidents)
| Ocean City: | 12.1 |
| Somers Point: | 8.7 |
| Pleasantville: | 22.7 |
| Atlantic City: | 10.3 |
| Brigantine: | 20.8 |
| Mays Landing: | 1.8 |
| Cape May Court House: | 11.8 |
| Wildwood: | 15.0 |
| Rio Grande: | 1.9 |
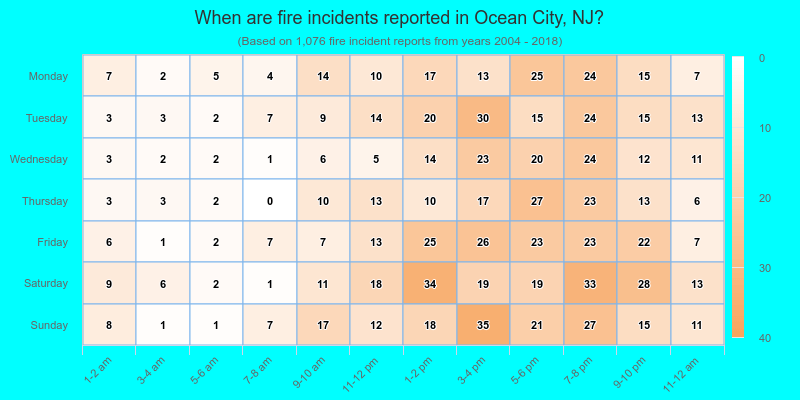
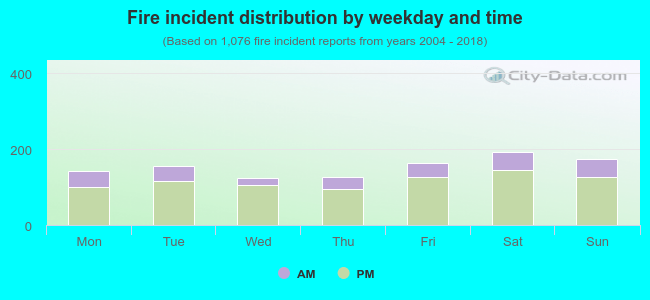 24.1% incidents where reported in the morning and 75.9% in the evening. The most fires (17.9%) took place on Saturday, and the least (11.4%) on Wednesday.
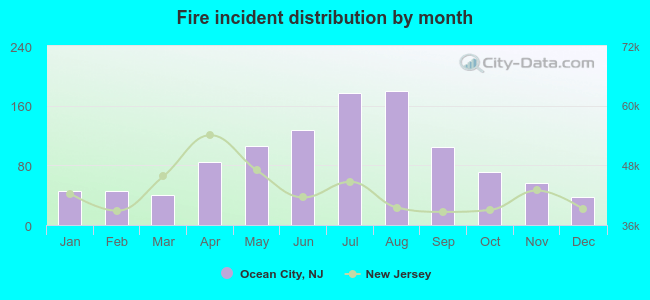 Based on the 1,076 fire incidents from years 2004 - 2018 most fires (16.6%) took place during August, and the least (3.5%) in December.
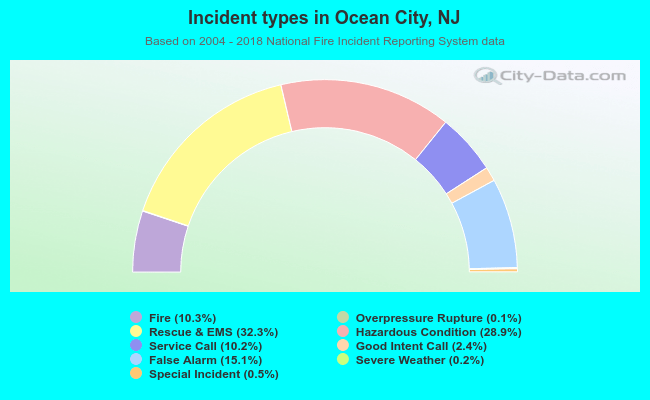 Out of all 10,462 cases reported during the years 2004 - 2018, the most belonged to the categories: Rescue & EMS (32.3%), Hazardous Condition (28.9%), and False Alarm (15.1%).
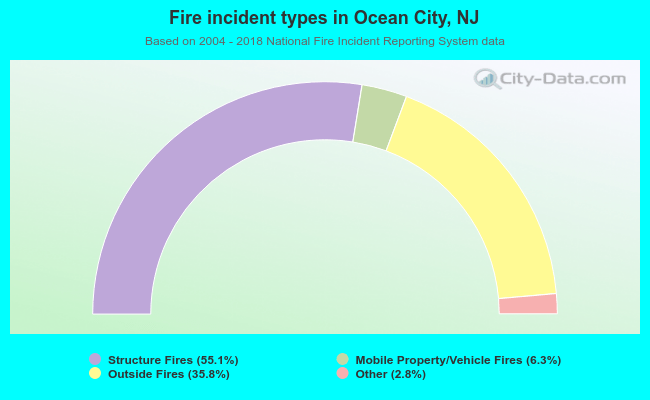 When looking into fire subcategories, the most reports belonged to: Structure Fires (55.1%), and Outside Fires (35.8%).