Ocean Shores: Fire Incidents, Washington (WA)
Where are fire incidents reported in Ocean Shores, WA
Something went wrong! Please refresh the page.
|
| |||||||||||||||||||||||||||||||||||||||||||||||||||||||||||||||||||||||||||||||||||||||||||||||||||||||||||||
2002 - 2018 National Fire Incident Reporting System (NFIRS) incidents
- Incident types reported to NFIRS in Ocean Shores, WA
- 68448.7%Fire
- 35525.3%Service Call
- 1248.8%Good Intent Call
- 1208.5%Hazardous Condition
- 775.5%False Alarm
- 292.1%Rescue & EMS
- 90.6%Special Incident
- 60.4%Overpressure Rupture
- Fire incident types reported to NFIRS in Ocean Shores, WA
- 46067.3%Outside Fires
- 11016.1%Structure Fires
- 8412.3%Other
- 304.4%Mobile Property/Vehicle Fires
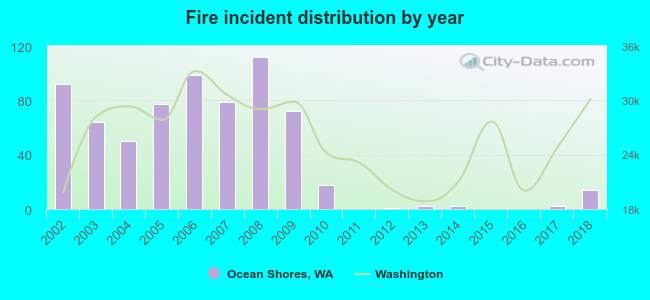 According to the data from the years 2002 - 2018 the average number of fires per year is 40. The highest number of reported fire incidents - 112 took place in 2008, and the least - 0 in 2011. The data has a decreasing trend.
The average number of yearly fire incidents per 10k residents in Ocean Shores, WA compared to nearest cities:
(Note: Based on data for the last 3 years, including only cities with population 5,000 and above)
| Ocean Shores: | 14.2 |
| Hoquiam: | 97.7 |
| Aberdeen: | 58.2 |
| Olympic: | 1.6 |
| Shelton: | 368.9 |
| Tumwater: | 58.6 |
| Centralia: | 104.3 |
| Olympia: | 118.4 |
| Chehalis: | 282.8 |
 The median response time based on all reported fire incidents is 6 minutes. This is comparable to the state median value.
The median response time in Ocean Shores, WA compared to nearest cities:
(Note: Based on data for all years, including only cities with at least 500 fire incidents)
| Ocean Shores: | 6 minutes |
| Westport: | 9 minutes |
| Hoquiam: | 5 minutes |
| Aberdeen: | 5 minutes |
| Montesano: | 9 minutes |
| Raymond: | 4 minutes |
| Ocean Park: | 6 minutes |
| Elma: | 10 minutes |
| Rochester: | 9 minutes |
 25.6% incidents where reported in the morning and 74.4% in the evening. The most fires (20.2%) took place on Saturday, and the least (11.0%) on Wednesday.
 Based on the 684 fire incidents from years 2002 - 2018 most fires (31.4%) took place during July, and the least (3.5%) in January.
 Out of all 1,405 cases reported during the years 2002 - 2018, the most belonged to the categories: Fire (48.7%), Service Call (25.3%), and Good Intent Call (8.8%).
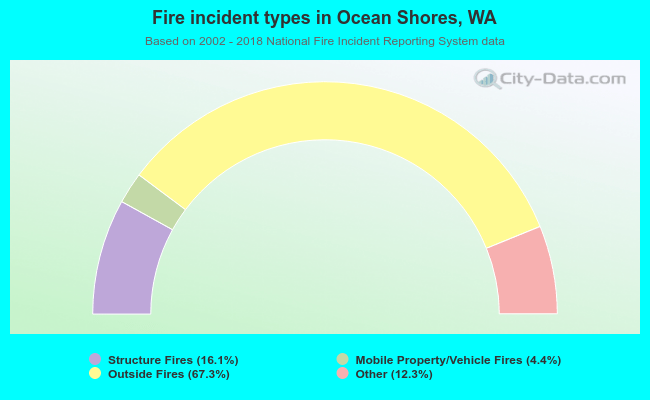 When looking into fire subcategories, the most reports belonged to: Outside Fires (67.3%), and Structure Fires (16.1%).