| Fire incidents reported |
|---|
| Sreet name | Count |
|---|
| WOODLAND AVENUE | 32 | | ATLANTIC AVE | 20 | | CEDAR NECK RD | 14 | | ATLANTIC AVENUE (26) | 10 | | CEDAR NECK RD | 10 | | CEDAR NECK ROAD (357) | 10 | | CENTRAL AVE | 10 | | WEST AVE | 10 | | WILLOW OAK AVENUE | 10 | | ATLANTIC AVE | 8 | | OLD MILL WAY | 8 | | SANDY COVE ROAD (358) | 8 | | ATLANTIC AV | 6 | | BEAVER DAM ROAD (368) | 6 | | BELLA VIA WAY | 6 | | CENTRAL AVENUE (357) | 6 | | EAST RIGA DR | 6 | | PARKER HOUSE ROAD (362) | 6 | | SANDY COVE RD | 6 | | WEST AVENUE | 6 | | WOODLAND AVE | 6 | | BIRCH ST | 4 | | BIRCH STREET | 4 | | CEDAR NECK ROAD | 4 | | CLUBHOUSE DR | 4 |
| | | Fire incidents reported |
|---|
| Sreet name | Count |
|---|
| CREEKSIDE CIRCLE | 4 | | HORSESHOE DR | 4 | | LOUGHLIN LANE | 4 | | LU LEE CT | 4 | | MARTINS WAY | 4 | | OCEAN AIR LN | 4 | | OCEAN MIST DR | 4 | | OCTOBER GLORY AV | 4 | | OCTOBER GLORY AVE | 4 | | OCTOBER GLORY AVENUE | 4 | | OLD MILL WAY | 4 | | PARKER HOUSE RD | 4 | | POSSUM ROAD | 4 | | SANDY COVE RD | 4 | | SANDY COVE ROAD | 4 | | SEABROOK ROAD | 4 | | WEST AVENUE (361) | 4 | | WHITES NECK RD | 4 | | 399 FRED HUDSON RD | 2 | | 11 MAY DRIVE | 2 | | 20 HOLLY LANE LANE | 2 | | 28 ATLANTIC AVE | 2 | | 30609 CEDAR NECK RD | 2 | | 37120 PINEWOOD RD | 2 | | 426 CANAL WAY EAST | 2 |
|
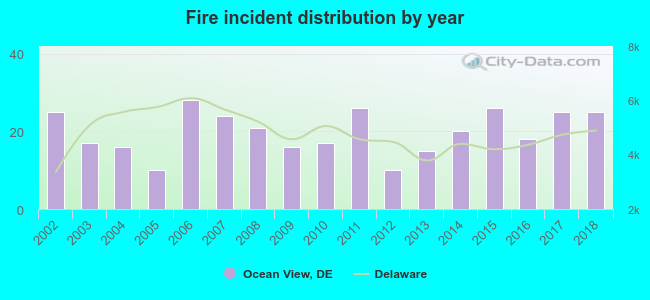 Based on the data from the years 2002 - 2018 the average number of fires per year is 20. The highest number of reported fires - 28 took place in 2006, and the least - 10 in 2005. The data has a constant trend.
 33.6% incidents where reported in the morning and 66.4% in the evening. The most fires (17.4%) took place on Sunday, and the least (8.8%) on Wednesday.
 Based on the 339 fire incidents from years 2002 - 2018 most fires (15.6%) took place during July, and the least (5.0%) in February.
 Out of all 1,321 cases reported during the years 2002 - 2018, the most belonged to the categories: Fire (25.7%), Rescue & EMS (24.1%), and False Alarm (22.6%).
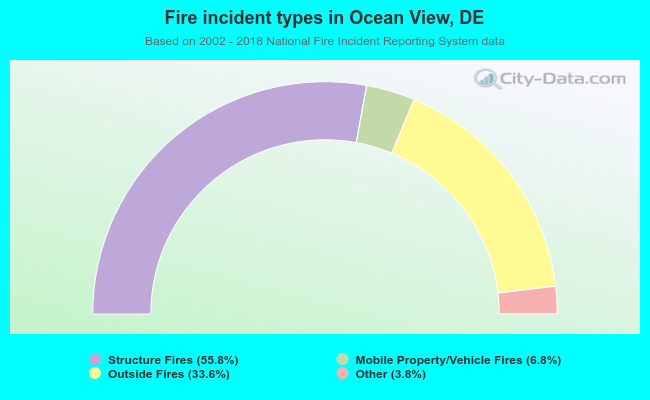 When looking into fire subcategories, the most incidents belonged to: Structure Fires (55.8%), and Outside Fires (33.6%).