| Fire incidents reported |
|---|
| Sreet name | Count |
|---|
| 8 HWY | 110 | | 98 HWY | 20 | | INTERSTATE 8 | 20 | | 8 | 18 | | IMPERIAL HWY | 18 | | EVAN HEWES HWY | 14 | | INTERSTATE 8 HWY | 14 | | 8 FWY | 12 | | INTERSTATE 8 FWY | 12 | | I-8 FWY | 10 | | INTERSTATE 8, MOUNTAIN SPRINGS | 10 | | EASTBOUND INTERSTATE 8 | 8 | | FRONTAGE RD | 6 | | MOUNTAIN SPRINGS RD | 6 | | SHELL CANYON RD | 6 | | HIGHWAY 98 HWY | 4 | | I-8 | 4 | | I8 HWY | 4 | | MOLITAR RD | 4 | | PALO VERDE AVE | 4 | | SHELL CANYON ROAD | 4 | | VIA DE ANZA RD | 4 | | 1021 PALO VERDE | 2 | | 3RD ST | 2 | | AGATE RD | 2 |
| | | Fire incidents reported |
|---|
| Sreet name | Count |
|---|
| BLM RD | 2 | | COYOTE 2 | 2 | | COYOTE 2 RD | 2 | | EVEN HEWES HWY | 2 | | HIGHWAY 8 HWY | 2 | | I-8 E BOUND | 2 | | I-8 HWY | 2 | | I-8 WEST BOUND | 2 | | IMPERIAL HIGHWAY | 2 | | IMPERIAL HWY HWY | 2 | | INKOPAH RD | 2 | | INTERSTAE 8 FWY | 2 | | INTERSTAE EIGHT | 2 | | INTERSTATE 8 EAST | 2 | | INTERSTATE 8, AT IN-KO-PA | 2 | | INTERSTATE 8/ WEST WYE | 2 | | INTERSTATE 8/WEST | 2 | | INTERSTATE 9 FWY | 2 | | INTERSTATE EIGHT | 2 | | MESQUITE ST | 2 | | MT SPRINGS RD | 2 | | OCOTILLA RD | 2 | | OCOTILLA STREET | 2 | | ON I-8 | 2 | | |
|
 According to the data from the years 2005 - 2018 the average number of fire incidents per year is 15. The highest number of reported fires - 25 took place in 2006, and the least - 9 in 2007. The data has a growing trend.
 32.1% incidents where reported in the morning and 67.9% in the evening. The most fires (16.7%) took place on Saturday, and the least (10.0%) on Wednesday.
 Based on the 209 reports from years 2005 - 2018 most fires (13.4%) took place during June, and the least (4.8%) in September.
 Out of all 834 cases reported during the years 2005 - 2018, the most belonged to the categories: Rescue & EMS (52.2%), Fire (25.1%), and Good Intent Call (11.9%).
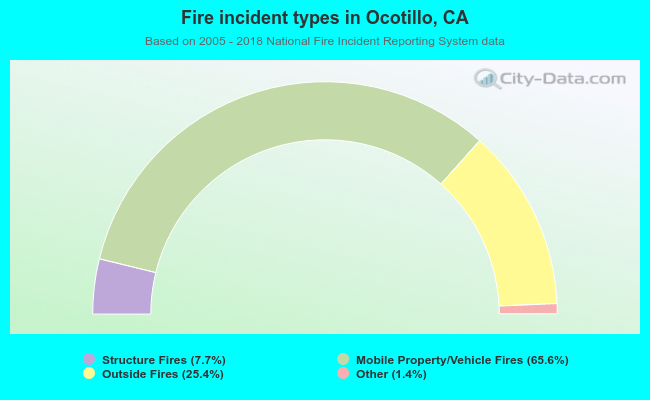 When looking into fire subcategories, the most reports belonged to: Mobile Property/Vehicle Fires (65.6%), and Outside Fires (25.4%).