Old Bridge: Fire Incidents, New Jersey (NJ)
Where are fire incidents reported in Old Bridge, NJ
Something went wrong! Please refresh the page.
| Fire incidents reported | |
|---|---|
| Sreet name | Count |
| TICETOWN RD | 190 |
| TICETOWN ROAD | 130 |
| ROUTE 9 | 58 |
| ROUTE 516 | 44 |
| ENGLISHTOWN RD | 30 |
| ROUTE 18 | 28 |
| ROUTE 9 HWY | 28 |
| RELLIM DR | 22 |
| BORDENTOWN AVE | 20 |
| ENGLISHTOWN ROAD | 20 |
| STRATFORD DR | 20 |
| CINDY STREET | 18 |
| COTTRELL RD | 18 |
| ROUTE 34 | 18 |
| JAKE BROWN RD | 16 |
| MARLBORO RD | 16 |
| PLEASANT VALLEY RD | 16 |
| ROUTE 18N | 16 |
| MIMI ROAD | 14 |
| CINDY ST | 12 |
| GRACE DR | 12 |
| MARLBORO ROAD | 12 |
| RT 9 | 12 |
| 100 TICETOWN | 10 |
| ARCADE LANE | 10 |
| CHEESEQUAKE FIREHOUSE | 10 |
| FALSTON CIRCLE | 10 |
| MADISON GDNS | 10 |
| MADISON PARK FIREHOUSE | 10 |
| PHILLIPS DR | 10 |
| Other | 367 |
2003 - 2018 National Fire Incident Reporting System (NFIRS) incidents
- Incident types reported to NFIRS in Old Bridge, NJ
- 1,26629.6%Hazardous Condition
- 1,20728.2%Fire
- 1,00323.5%False Alarm
- 3147.3%Good Intent Call
- 2866.7%Service Call
- 1022.4%Rescue & EMS
- 481.1%Overpressure Rupture
- 350.8%Severe Weather
- 130.3%Special Incident
- Fire incident types reported to NFIRS in Old Bridge, NJ
- 61751.1%Structure Fires
- 35129.1%Outside Fires
- 15612.9%Mobile Property/Vehicle Fires
- 836.9%Other
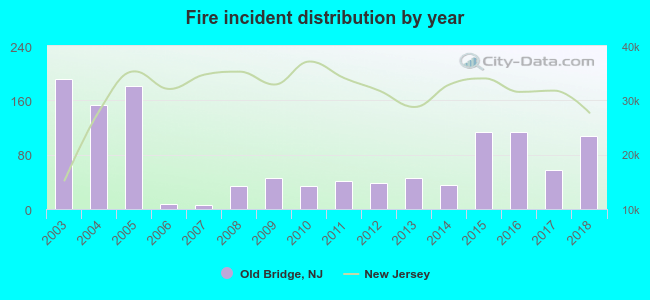 According to the data from the years 2003 - 2018 the average number of fire incidents per year is 75. The highest number of reported fire incidents - 191 took place in 2003, and the least - 6 in 2007. The data has a dropping trend.
The average number of yearly fire incidents per 10k residents in Old Bridge, NJ compared to nearest cities:
(Note: Based on data for the last 3 years, including only cities with population 5,000 and above)
| Old Bridge: | 38.9 |
| Spotswood: | 16.0 |
| South River: | 15.5 |
| East Brunswick: | 18.2 |
| Sayreville: | 11.2 |
| Morganville: | 36.4 |
| Matawan: | 41.3 |
| Laurence Harbor: | 5.4 |
| South Amboy: | 51.2 |
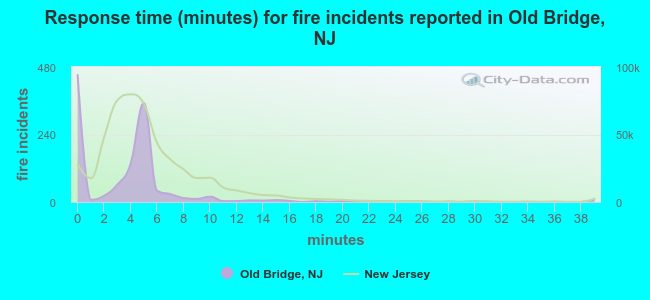 The median response time based on all reported fire incidents is 4 minutes. This is lower compared to the state median value.
The median response time in Old Bridge, NJ compared to nearest cities:
(Note: Based on data for all years, including only cities with at least 500 fire incidents)
| Old Bridge: | 4 minutes |
| East Brunswick: | 5 minutes |
| Sayreville: | 5 minutes |
| Morganville: | 4 minutes |
| Matawan: | 4 minutes |
| South Amboy: | 3 minutes |
| Keyport: | 4 minutes |
| Highland Park: | 2 minutes |
| New Brunswick: | 3 minutes |
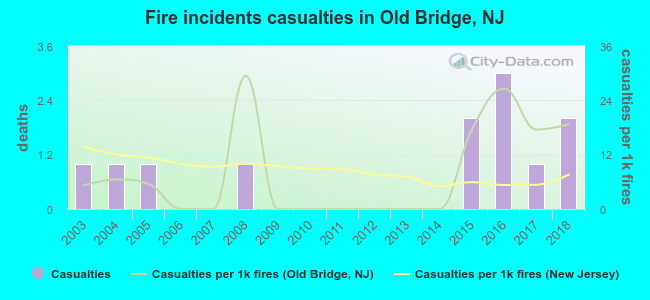 According to the reports from the years 2003 - 2018 the average number of fire-related casualties per year is 1. The highest number of reported injuries - 3 took place in 2016, and the lowest - 0 in 2006. The data has a rising trend.
The average number of injuries per 1,000 fires is 8. This indicator was the highest - 29 in 2008, and the lowest 0 in 2006. The trend for injuries per 1,000 fires is rising. Compared to the New Jersey value the number of injuries per 1,000 fires is about the same.
According to the reports from the years 2003 - 2018 the average number of fire-related casualties per year is 1. The highest number of reported injuries - 3 took place in 2016, and the lowest - 0 in 2006. The data has a rising trend.
The average number of injuries per 1,000 fires is 8. This indicator was the highest - 29 in 2008, and the lowest 0 in 2006. The trend for injuries per 1,000 fires is rising. Compared to the New Jersey value the number of injuries per 1,000 fires is about the same.Casualties per 1,000 incidents in Old Bridge, NJ compared to nearest cities:
(Note: Based on data for all years, including only cities with at least 500 fire incidents)
| Old Bridge: | 9.9 |
| East Brunswick: | 7.0 |
| Sayreville: | 17.3 |
| Morganville: | 1.7 |
| Matawan: | 8.2 |
| South Amboy: | 13.2 |
| Keyport: | 20.6 |
| Highland Park: | 7.3 |
| New Brunswick: | 11.6 |
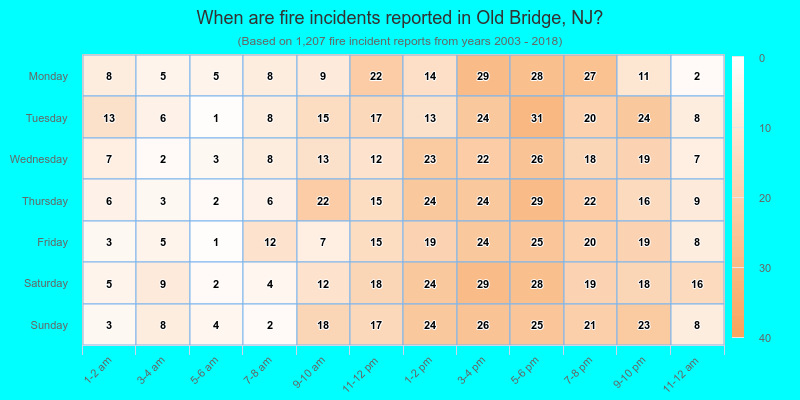
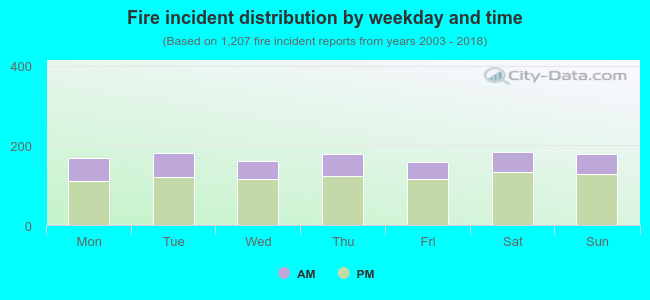 29.9% incidents where reported in the morning and 70.1% in the evening. The most fires (15.2%) took place on Saturday, and the least (13.1%) on Friday.
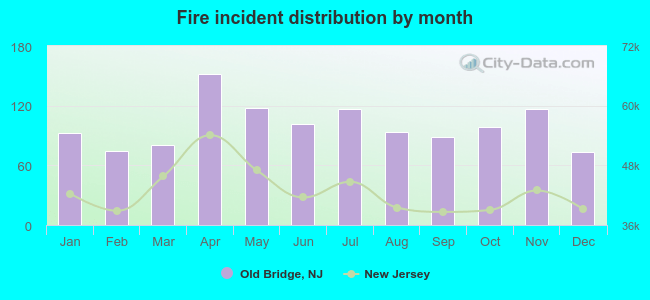 Based on the 1,207 fire incidents from years 2003 - 2018 most fires (12.6%) took place during April, and the least (6.0%) in December.
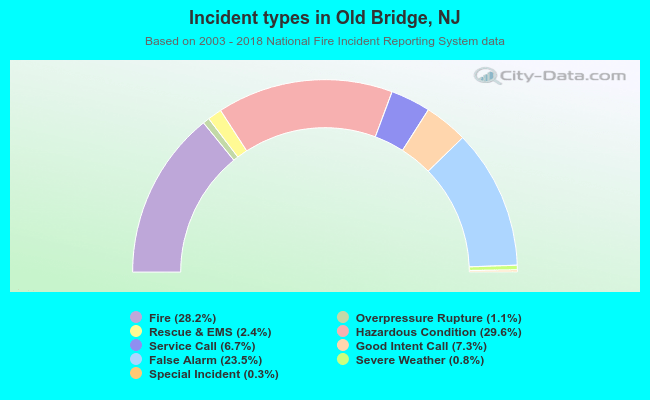 Out of all 4,274 cases reported during the years 2003 - 2018, the most belonged to the categories: Hazardous Condition (29.6%), Fire (28.2%), and False Alarm (23.5%).
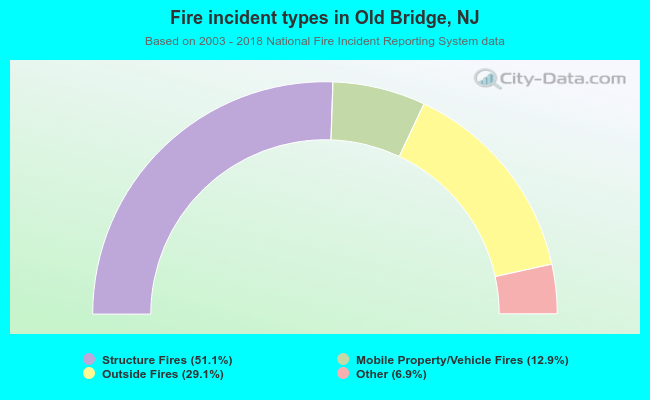 When looking into fire subcategories, the most incidents belonged to: Structure Fires (51.1%), and Outside Fires (29.1%).