Ontario: Fire Incidents, California (CA)
Where are fire incidents reported in Ontario, CA
Something went wrong! Please refresh the page.
| Fire incidents reported | |
|---|---|
| Sreet name | Count |
| 4TH ST | 382 |
| RIVERSIDE DR | 272 |
| EUCLID AVE | 220 |
| GROVE AVE | 212 |
| D ST | 196 |
| PHILADELPHIA ST | 182 |
| HOLT BLVD | 172 |
| ARCHIBALD AVE | 158 |
| MOUNTAIN AVE | 156 |
| VINEYARD AVE | 148 |
| MISSION BLVD | 146 |
| 6TH ST | 136 |
| HAVEN AVE | 128 |
| 5TH ST | 122 |
| G ST | 118 |
| FRANCIS ST | 112 |
| B ST | 104 |
| BON VIEW AVE | 98 |
| CUCAMONGA AVE | 94 |
| EUCLID AV | 90 |
| JURUPA ST | 90 |
| AIRPORT DR | 88 |
| CAMPUS AVE | 88 |
| SULTANA AVE | 84 |
| STATE ST | 80 |
| NOCTA ST | 78 |
| GUASTI RD | 76 |
| HOLT BL | 76 |
| MILLIKEN AVE | 72 |
| ARCHIBALD AV | 68 |
| Other | 1,615 |
2005 - 2017 National Fire Incident Reporting System (NFIRS) incidents
- Incident types reported to NFIRS in Ontario, CA
- 23,88658.2%Rescue & EMS
- 5,66113.8%Fire
- 4,0089.8%Good Intent Call
- 3,8449.4%Hazardous Condition
- 1,8574.5%False Alarm
- 1,7754.3%Service Call
- Fire incident types reported to NFIRS in Ontario, CA
- 2,34441.4%Outside Fires
- 1,68129.7%Structure Fires
- 1,61128.5%Mobile Property/Vehicle Fires
- 250.4%Other
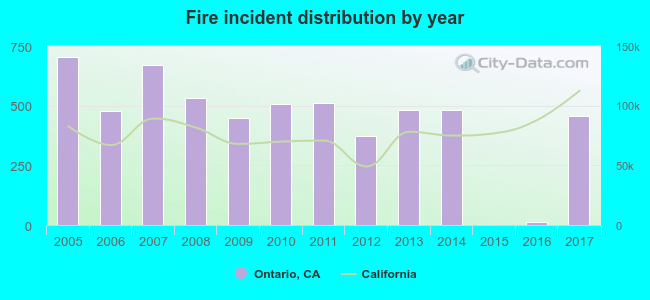 Based on the data from the years 2005 - 2017 the average number of fires per year is 435. The highest number of reported fire incidents - 703 took place in 2005, and the least - 2 in 2015. The data has a declining trend.
The average number of yearly fire incidents per 10k residents in Ontario, CA compared to nearest cities:
(Note: Based on data for the last 3 years, including only cities with population 5,000 and above)
| Ontario: | 9.3 |
| Montclair: | 3.8 |
| Chino: | 11.2 |
| Upland: | 6.6 |
| Rancho Cucamonga: | 13.9 |
| Claremont: | 16.7 |
| Eastvale: | 0.2 |
| Pomona: | 27.8 |
| Chino Hills: | 5.7 |
 The median response time based on all reported fire incidents is 6 minutes. This is close to the state median value.
The median response time in Ontario, CA compared to nearest cities:
(Note: Based on data for all years, including only cities with at least 500 fire incidents)
| Ontario: | 6 minutes |
| Montclair: | 6 minutes |
| Chino: | 6 minutes |
| Rancho Cucamonga: | 7 minutes |
| Claremont: | 5 minutes |
| Pomona: | 5 minutes |
| La Verne: | 5 minutes |
| Fontana: | 7 minutes |
| San Dimas: | 5 minutes |
 According to the reports from the years 2005 - 2017 the average number of fire-related yearly deaths is 1. The highest number of reported deaths - 5 took place in 2010, and the lowest - 0 in 2005. The data has a constant trend.
The average number of fatalities per 1,000 fires is 1. This indicator was the highest - 10 in 2010, and the lowest 0 in 2005. The trend for fatalities per 1,000 fires is constant. Compared to the California value the number of fatalities per 1,000 incidents is about the same.
According to the reports from the years 2005 - 2017 the average number of fire-related yearly deaths is 1. The highest number of reported deaths - 5 took place in 2010, and the lowest - 0 in 2005. The data has a constant trend.
The average number of fatalities per 1,000 fires is 1. This indicator was the highest - 10 in 2010, and the lowest 0 in 2005. The trend for fatalities per 1,000 fires is constant. Compared to the California value the number of fatalities per 1,000 incidents is about the same.Deaths per 1,000 incidents in Ontario, CA compared to nearest cities:
(Note: Based on data for all years, including only cities with at least 2,500 fire incidents)
| Ontario: | 1.6 |
| Rancho Cucamonga: | 1.5 |
| Pomona: | 0.5 |
| Riverside: | 2.5 |
| Colton: | 2.8 |
| Anaheim: | 0.9 |
 Based on the data from the years 2005 - 2017 the average number of fire-related casualties per year is 6. The highest number of injuries - 20 took place in 2011, and the lowest - 0 in 2015. The data has a growing trend.
The average number of injuries per 1,000 fire incidents is 13. This indicator was the highest - 39 in 2011, and the lowest 0 in 2015. The trend for injuries per 1,000 incidents is increasing. Compared to the California value the number of casualties per 1,000 fires is much higher.
Based on the data from the years 2005 - 2017 the average number of fire-related casualties per year is 6. The highest number of injuries - 20 took place in 2011, and the lowest - 0 in 2015. The data has a growing trend.
The average number of injuries per 1,000 fire incidents is 13. This indicator was the highest - 39 in 2011, and the lowest 0 in 2015. The trend for injuries per 1,000 incidents is increasing. Compared to the California value the number of casualties per 1,000 fires is much higher.
 33.7% incidents where reported in the morning and 66.3% in the evening. The most fires (15.1%) took place on Saturday, and the least (13.4%) on Tuesday.
 Based on the 5,661 fire incident reports from years 2005 - 2017 most fires (11.1%) took place during July, and the least (5.3%) in February.
 Out of all 41,073 cases reported during the years 2005 - 2017, the most belonged to the categories: Rescue & EMS (58.2%), Fire (13.8%), and Good Intent Call (9.8%).
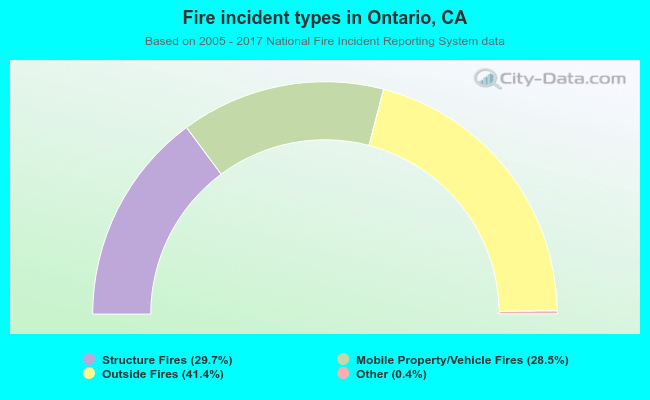 When looking into fire subcategories, the most reports belonged to: Outside Fires (41.4%), and Structure Fires (29.7%).