Oroville: Fire Incidents, California (CA)
Where are fire incidents reported in Oroville, CA
Something went wrong! Please refresh the page.
| Fire incidents reported | |
|---|---|
| Sreet name | Count |
| ORO DAM BLVD | 138 |
| OLIVE HWY | 80 |
| LINCOLN BLVD | 64 |
| HWY 70 | 60 |
| ORO BANGOR HWY | 48 |
| BIRD ST | 44 |
| FEATHER RIVER BLVD | 42 |
| NELSON AVE | 42 |
| GRAND AVE | 38 |
| FOOTHILL BLVD | 34 |
| MITCHELL AVE | 34 |
| 70 HWY | 32 |
| MONTGOMERY ST | 32 |
| MYERS ST | 30 |
| HIGHWAY 70 | 28 |
| ORODAM BLVD | 28 |
| ORODAM | 26 |
| CHEROKEE RD | 24 |
| STUMPS FIELD | 24 |
| ACACIA AVE | 22 |
| GILMORE LN | 22 |
| LONE TREE RD | 22 |
| PLUMAS AVE | 22 |
| TABLE MOUNTAIN BLVD | 22 |
| 5TH AVE | 20 |
| LARKIN RD | 20 |
| MYERS | 20 |
| OPHIR RD | 20 |
| ORO DAM | 20 |
| ORO DAM BLVD. | 20 |
| Other | 1,271 |
2003 - 2018 National Fire Incident Reporting System (NFIRS) incidents
- Incident types reported to NFIRS in Oroville, CA
- 2,39336.5%Rescue & EMS
- 2,34935.8%Fire
- 6399.8%Hazardous Condition
- 4877.4%Service Call
- 2744.2%False Alarm
- 2203.4%Good Intent Call
- 1772.7%Special Incident
- 80.1%Overpressure Rupture
- Fire incident types reported to NFIRS in Oroville, CA
- 1,08846.3%Outside Fires
- 80234.1%Structure Fires
- 30112.8%Mobile Property/Vehicle Fires
- 1586.7%Other
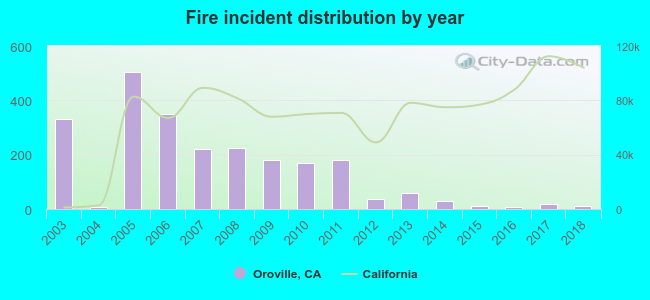 Based on the data from the years 2003 - 2018 the average number of fire incidents per year is 147. The highest number of reported fires - 506 took place in 2005, and the least - 8 in 2004. The data has a decreasing trend.
The average number of yearly fire incidents per 10k residents in Oroville, CA compared to nearest cities:
(Note: Based on data for the last 3 years, including only cities with population 5,000 and above)
| Oroville: | 7.8 |
| Thermalito: | 30.6 |
| Palermo: | 78.7 |
| Gridley: | 7.6 |
| Feather Falls: | 7.9 |
| Durham: | 19.9 |
| Paradise: | 4.4 |
| Chico: | 40.1 |
| Magalia: | 0.9 |
 The median response time based on all reported fire incidents is 4 minutes. This is lower compared to the state median value.
The median response time in Oroville, CA compared to nearest cities:
(Note: Based on data for all years, including only cities with at least 500 fire incidents)
| Oroville: | 4 minutes |
| Palermo: | 7 minutes |
| Paradise: | 4 minutes |
| Chico: | 5 minutes |
| Marysville: | 6 minutes |
| Yuba City: | 6 minutes |
| Penn Valley: | 10 minutes |
| Olivehurst: | 5 minutes |
| Colusa: | 5 minutes |
 According to the data from the years 2003 - 2018 the average number of fire-related yearly deaths is 1. The highest number of deaths - 7 took place in 2005, and the lowest - 0 in 2003. The data has a constant trend.
 Based on the reports from the years 2003 - 2018 the average number of fire-related yearly casualties is 0. The highest number of reported casualties - 2 took place in 2009, and the lowest - 0 in 2004. The data has a dropping trend.
The average number of injuries per 1,000 fire incidents is 3. This indicator was the highest - 29 in 2012, and the lowest 0 in 2004. The trend for injuries per 1,000 fires is declining. Compared to the state value the number of casualties per 1,000 fires is much lower.
Based on the reports from the years 2003 - 2018 the average number of fire-related yearly casualties is 0. The highest number of reported casualties - 2 took place in 2009, and the lowest - 0 in 2004. The data has a dropping trend.
The average number of injuries per 1,000 fire incidents is 3. This indicator was the highest - 29 in 2012, and the lowest 0 in 2004. The trend for injuries per 1,000 fires is declining. Compared to the state value the number of casualties per 1,000 fires is much lower.Casualties per 1,000 incidents in Oroville, CA compared to nearest cities:
(Note: Based on data for all years, including only cities with at least 500 fire incidents)
| Oroville: | 2.1 |
| Palermo: | 0.0 |
| Paradise: | 2.7 |
| Chico: | 6.6 |
| Marysville: | 1.5 |
| Yuba City: | 6.3 |
| Penn Valley: | 6.6 |
| Olivehurst: | 1.8 |
| Colusa: | 0.0 |
 32.6% incidents where reported in the morning and 67.4% in the evening. The most fires (15.1%) took place on Thursday, and the least (13.2%) on Sunday.
 Based on the 2,349 fire incidents from years 2003 - 2018 most fires (13.6%) took place during June, and the least (4.1%) in March.
 Out of all 6,553 cases reported during the years 2003 - 2018, the most belonged to the categories: Rescue & EMS (36.5%), Fire (35.8%), and Hazardous Condition (9.8%).
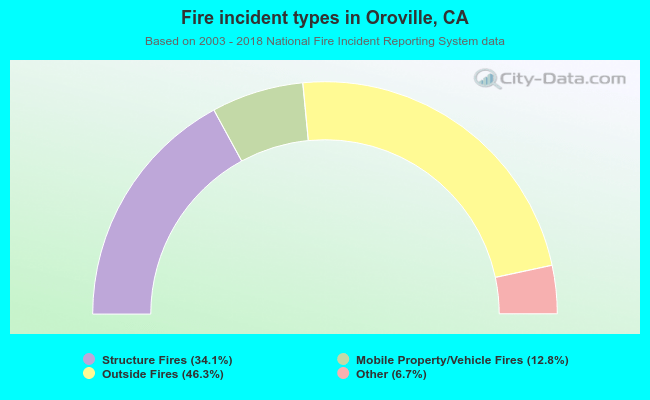 When looking into fire subcategories, the most incidents belonged to: Outside Fires (46.3%), and Structure Fires (34.1%).