Painesville: Fire Incidents, Ohio (OH)
Where are fire incidents reported in Painesville, OH
Something went wrong! Please refresh the page.
| Fire incidents reported | |
|---|---|
| Sreet name | Count |
| JACKSON ST | 246 |
| STATE ST | 180 |
| ERIE ST | 154 |
| MENTOR AVE | 142 |
| WASHINGTON ST | 142 |
| BRENTWOOD DR | 98 |
| RICHMOND ST | 94 |
| ST CLAIR ST | 94 |
| CHESTER ST | 86 |
| WALNUT ST | 84 |
| LIBERTY ST | 66 |
| KENSINGTON AVE | 58 |
| PROSPECT ST | 56 |
| PARK PL | 44 |
| MAIN ST | 42 |
| NEWELL ST | 42 |
| SOUTH ST | 40 |
| ARGONNE DR | 36 |
| CHESTNUT ST | 36 |
| HIGH ST | 32 |
| MILL ST | 30 |
| SAINT CLAIR ST | 30 |
| STAGE AVE | 30 |
| BANK ST | 28 |
| NEBRASKA ST | 28 |
| ACADEMY CT | 24 |
| ARGONNE ARMS | 24 |
| PEARL ST | 24 |
| SKINNER AVE | 24 |
| BRENTWOOD | 22 |
2002 - 2018 National Fire Incident Reporting System (NFIRS) incidents
- Incident types reported to NFIRS in Painesville, OH
- 15,21756.7%Rescue & EMS
- 2,83310.6%Service Call
- 2,77710.3%Good Intent Call
- 2,68210.0%Hazardous Condition
- 1,9547.3%Fire
- 1,2574.7%False Alarm
- 1130.4%Overpressure Rupture
- Fire incident types reported to NFIRS in Painesville, OH
- 1,36069.6%Structure Fires
- 41021.0%Outside Fires
- 1759.0%Mobile Property/Vehicle Fires
- 90.5%Other
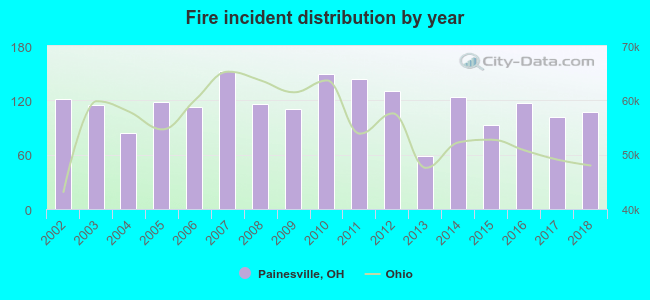 Based on the data from the years 2002 - 2018 the average number of fire incidents per year is 115. The highest number of reported fires - 152 took place in 2007, and the least - 59 in 2013. The data has a decreasing trend.
The average number of yearly fire incidents per 10k residents in Painesville, OH compared to nearest cities:
(Note: Based on data for the last 3 years, including only cities with population 5,000 and above)
| Painesville: | 54.8 |
| Mentor: | 21.3 |
| Willoughby: | 58.9 |
| Kirtland: | 63.1 |
| Chardon: | 147.8 |
| Eastlake: | 50.2 |
| North Madison: | 1.2 |
| Willowick: | 35.7 |
| Willoughby Hills: | 56.7 |
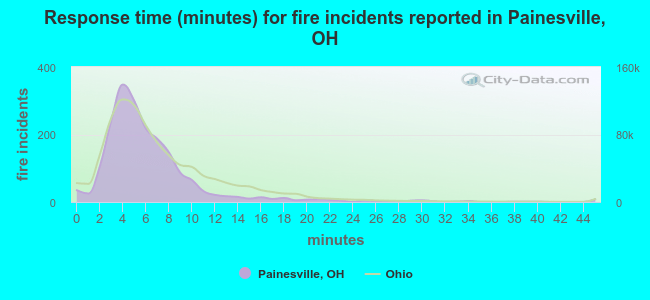 The median response time based on all reported fire incidents is 5 minutes. This is lower than the Ohio median value.
The median response time in Painesville, OH compared to nearest cities:
(Note: Based on data for all years, including only cities with at least 500 fire incidents)
| Painesville: | 5 minutes |
| Mentor: | 6 minutes |
| Perry: | 6 minutes |
| Willoughby: | 4 minutes |
| Kirtland: | 6 minutes |
| Chardon: | 7 minutes |
| Eastlake: | 5 minutes |
| Madison: | 7 minutes |
| Willowick: | 4 minutes |
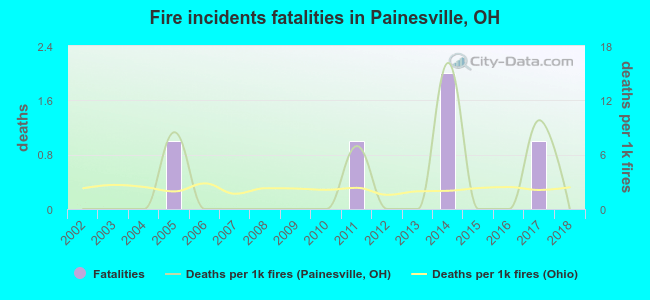 According to the data from the years 2002 - 2018 the average number of fire-related yearly deaths is 0. The highest number of deaths - 2 took place in 2014, and the lowest - 0 in 2002. The data has a constant trend.
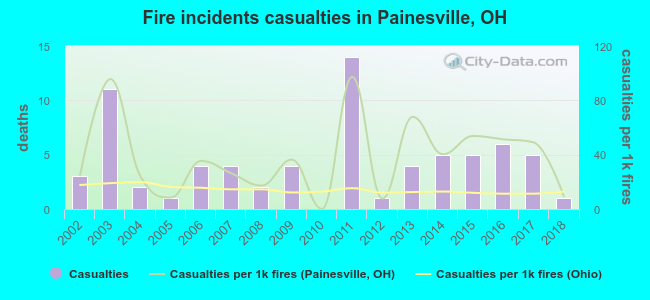 According to the reports from the years 2002 - 2018 the average number of fire-related casualties per year is 4. The highest number of injuries - 14 took place in 2011, and the lowest - 0 in 2010. The data has a dropping trend.
The average number of injuries per 1,000 fires is 38. This indicator was the highest - 97 in 2011, and the lowest 0 in 2010. The trend for injuries per 1,000 fires is declining. Compared to the Ohio value the number of injuries per 1,000 fire incidents is much higher.
According to the reports from the years 2002 - 2018 the average number of fire-related casualties per year is 4. The highest number of injuries - 14 took place in 2011, and the lowest - 0 in 2010. The data has a dropping trend.
The average number of injuries per 1,000 fires is 38. This indicator was the highest - 97 in 2011, and the lowest 0 in 2010. The trend for injuries per 1,000 fires is declining. Compared to the Ohio value the number of injuries per 1,000 fire incidents is much higher.
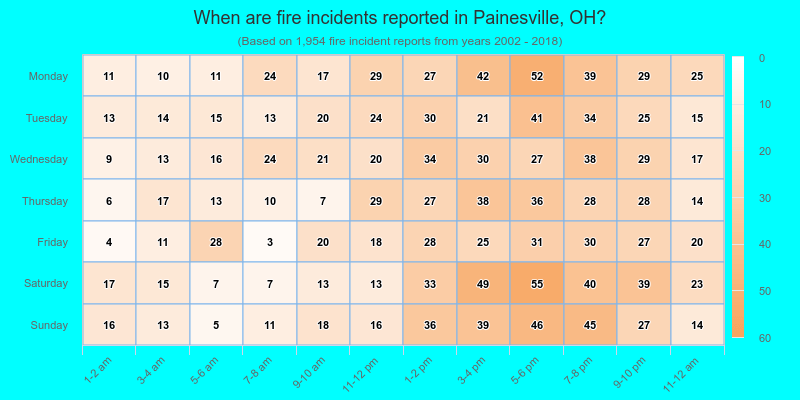
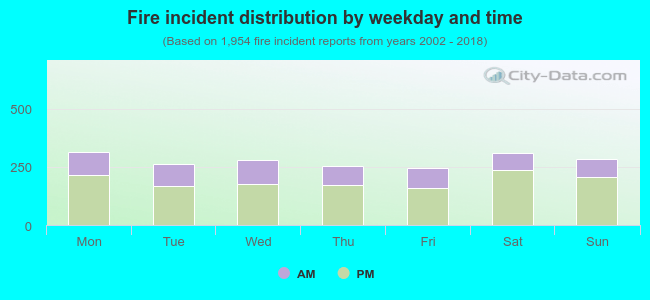 31.8% incidents where reported in the morning and 68.2% in the evening. The most fires (16.2%) took place on Monday, and the least (12.5%) on Friday.
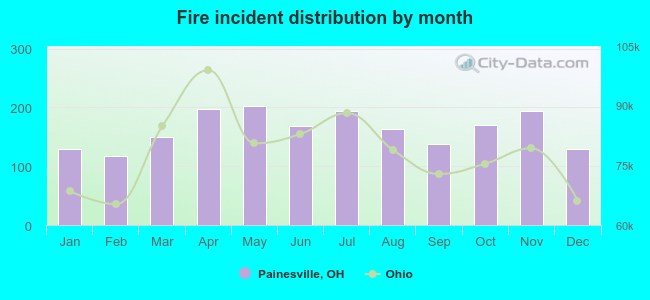 According to the 1,954 fire incident reports from years 2002 - 2018 most fires (10.4%) took place during May, and the least (6.0%) in February.
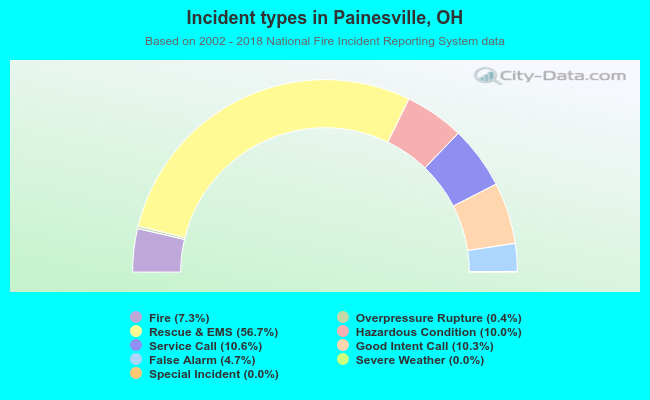 Out of all 26,850 cases reported during the years 2002 - 2018, the most belonged to the categories: Rescue & EMS (56.7%), Service Call (10.6%), and Good Intent Call (10.3%).
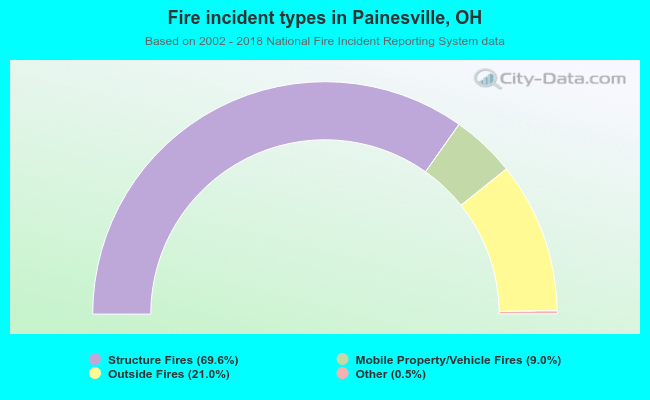 When looking into fire subcategories, the most incidents belonged to: Structure Fires (69.6%), and Outside Fires (21.0%).