Palmyra: Fire Incidents, New Jersey (NJ)
Where are fire incidents reported in Palmyra, NJ
Something went wrong! Please refresh the page.
|
| |||||||||||||||||||||||||||||||||||||||||||||||||||||||||||||||||||||||||||||||||||||||||||||||||||||||||||||
2003 - 2018 National Fire Incident Reporting System (NFIRS) incidents
- Incident types reported to NFIRS in Palmyra, NJ
- 87141.2%Hazardous Condition
- 60528.6%Fire
- 31514.9%False Alarm
- 1155.4%Service Call
- 1085.1%Rescue & EMS
- 874.1%Good Intent Call
- 100.5%Severe Weather
- 40.2%Overpressure Rupture
- Fire incident types reported to NFIRS in Palmyra, NJ
- 31251.6%Structure Fires
- 17729.3%Outside Fires
- 7412.2%Mobile Property/Vehicle Fires
- 426.9%Other
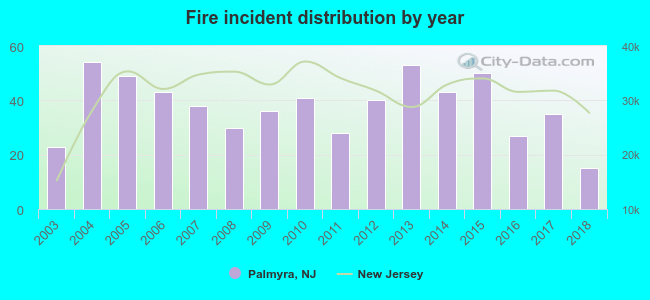 According to the data from the years 2003 - 2018 the average number of fire incidents per year is 38. The highest number of reported fire incidents - 54 took place in 2004, and the least - 15 in 2018. The data has a declining trend.
The average number of yearly fire incidents per 10k residents in Palmyra, NJ compared to nearest cities:
(Note: Based on data for the last 3 years, including only cities with population 5,000 and above)
| Palmyra: | 35.0 |
| Pennsauken: | 43.1 |
| Camden: | 55.5 |
| Franklin Park: | 26.3 |
| Collingswood: | 84.3 |
| Haddonfield: | 26.9 |
| Audubon: | 35.6 |
| Haddon Heights: | 29.4 |
| Marlton: | 8.6 |
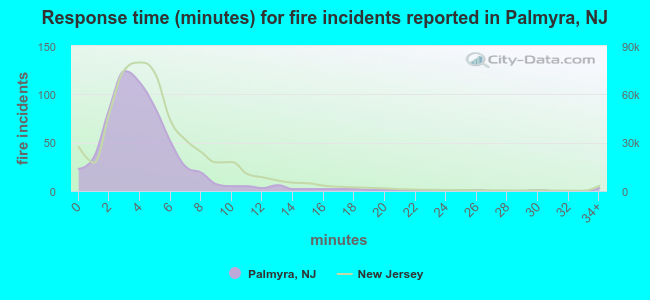 The median response time based on all reported fire incidents is 4 minutes. This is lower compared to the state median value.
The median response time in Palmyra, NJ compared to nearest cities:
(Note: Based on data for all years, including only cities with at least 500 fire incidents)
| Palmyra: | 4 minutes |
| Pennsauken: | 5 minutes |
| Camden: | 4 minutes |
| Collingswood: | 4 minutes |
| Haddonfield: | 6 minutes |
| Audubon: | 5 minutes |
| Haddon Heights: | 6 minutes |
| Gloucester City: | 4 minutes |
| Barrington: | 7 minutes |
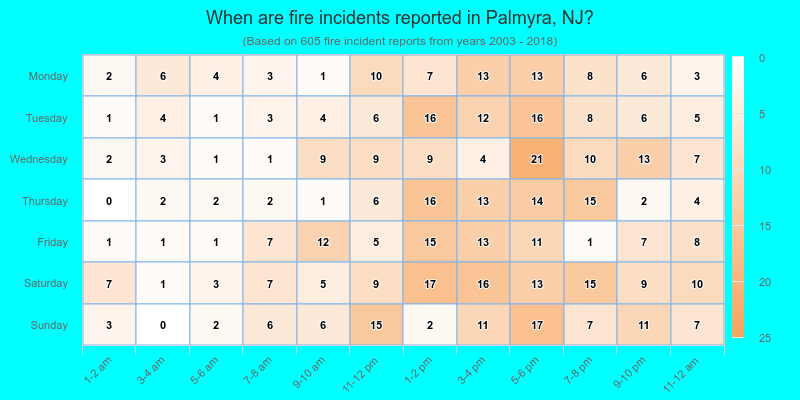
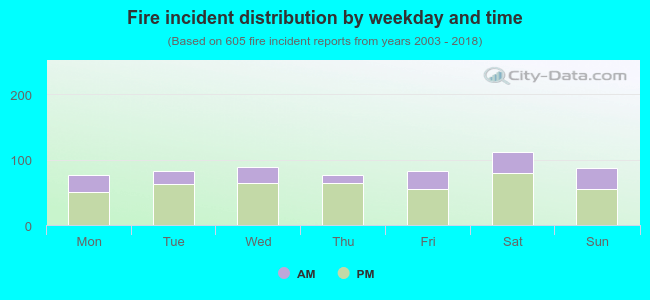 28.8% incidents where reported in the morning and 71.2% in the evening. The most fires (18.5%) took place on Saturday, and the least (12.6%) on Monday.
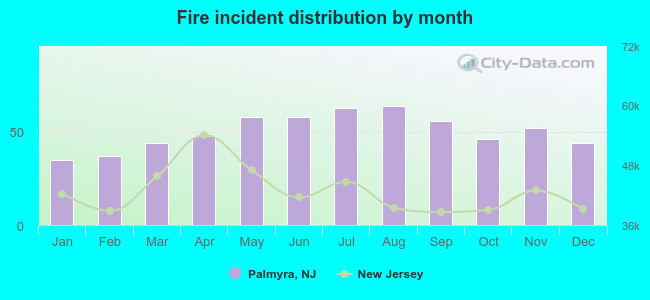 Based on the 605 fire incidents from years 2003 - 2018 most fires (10.6%) took place during August, and the least (5.8%) in January.
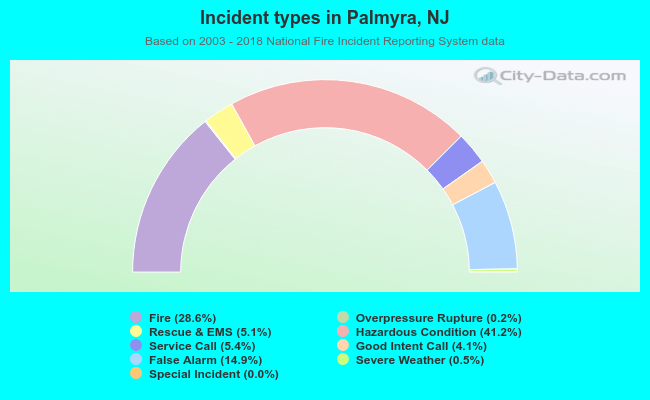 Out of all 2,116 cases reported during the years 2003 - 2018, the most belonged to the categories: Hazardous Condition (41.2%), Fire (28.6%), and False Alarm (14.9%).
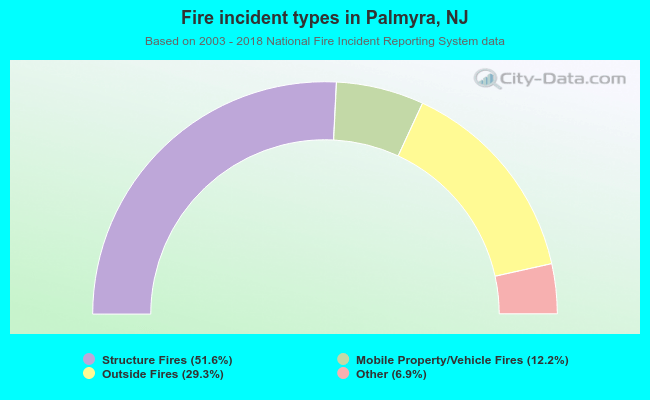 When looking into fire subcategories, the most incidents belonged to: Structure Fires (51.6%), and Outside Fires (29.3%).