Perth Amboy: Fire Incidents, New Jersey (NJ)
Where are fire incidents reported in Perth Amboy, NJ
Something went wrong! Please refresh the page.
| Fire incidents reported | |
|---|---|
| Sreet name | Count |
| STATE ST | 470 |
| SMITH ST | 334 |
| NEW BRUNSWICK AVE | 254 |
| HIGH ST | 202 |
| CONVERY BLVD | 170 |
| FAYETTE ST | 160 |
| CORTLAND ST | 146 |
| AMBOY AVE | 140 |
| MADISON AVE | 118 |
| WASHINGTON ST | 112 |
| MARKET ST | 100 |
| HALL AVE | 86 |
| CORTLANDT ST | 78 |
| HARNED ST | 74 |
| RECTOR ST | 68 |
| KING ST | 64 |
| FLORIDA GROVE RD | 62 |
| CHARLES ST | 56 |
| CENTRAL FIREHOUSE | 52 |
| BROAD ST | 50 |
| SECOND ST | 50 |
| BRIGHTON AVE | 48 |
| HARBOR TER | 48 |
| JEFFERSON ST | 48 |
| ELM ST | 46 |
| FIRST ST | 44 |
| LEWIS ST | 44 |
| NEVILLE ST | 44 |
| WEST SIDE AVE | 42 |
| GRANT ST | 40 |
2002 - 2018 National Fire Incident Reporting System (NFIRS) incidents
- Incident types reported to NFIRS in Perth Amboy, NJ
- 5,53136.1%Hazardous Condition
- 3,02219.7%Rescue & EMS
- 2,90719.0%Fire
- 2,19214.3%False Alarm
- 9206.0%Service Call
- 6804.4%Good Intent Call
- 480.3%Special Incident
- 300.2%Severe Weather
- Fire incident types reported to NFIRS in Perth Amboy, NJ
- 1,67157.5%Structure Fires
- 85029.2%Outside Fires
- 31010.7%Mobile Property/Vehicle Fires
- 762.6%Other
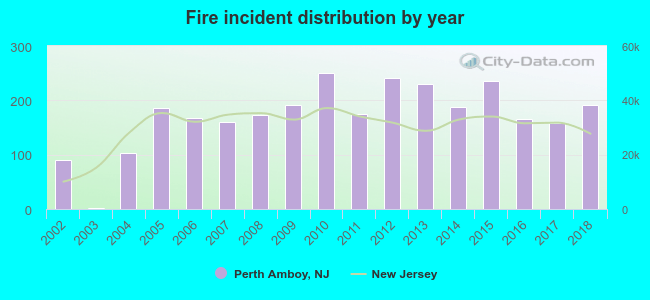 Based on the data from the years 2002 - 2018 the average number of fire incidents per year is 171. The highest number of fire incidents - 250 took place in 2010, and the least - 1 in 2003. The data has a rising trend.
The average number of yearly fire incidents per 10k residents in Perth Amboy, NJ compared to nearest cities:
(Note: Based on data for the last 3 years, including only cities with population 5,000 and above)
| Perth Amboy: | 32.8 |
| Fords: | 1.1 |
| Woodbridge: | 34.1 |
| South Amboy: | 51.2 |
| Avenel: | 25.3 |
| Iselin: | 22.5 |
| Sayreville: | 11.2 |
| Metuchen: | 13.7 |
| Carteret: | 24.1 |
 The median response time based on all reported fire incidents is 4 minutes. This is lower than the state median value.
The median response time in Perth Amboy, NJ compared to nearest cities:
(Note: Based on data for all years, including only cities with at least 500 fire incidents)
| Perth Amboy: | 4 minutes |
| Woodbridge: | 5 minutes |
| South Amboy: | 3 minutes |
| Avenel: | 4 minutes |
| Iselin: | 5 minutes |
| Sayreville: | 5 minutes |
| Carteret: | 3 minutes |
| Colonia: | 5 minutes |
| Rahway: | 3 minutes |
 Based on the reports from the years 2002 - 2018 the average number of fire-related yearly deaths is 0. The highest number of reported deaths - 2 took place in 2018, and the lowest - 0 in 2002. The data has a rising trend.
The average number of deaths per 1,000 fire incidents is 2. This indicator was the highest - 10 in 2018, and the lowest 0 in 2002. The trend for fatalities per 1,000 fire incidents is rising. Compared to the New Jersey value the number of fatalities per 1,000 fires is higher.
Based on the reports from the years 2002 - 2018 the average number of fire-related yearly deaths is 0. The highest number of reported deaths - 2 took place in 2018, and the lowest - 0 in 2002. The data has a rising trend.
The average number of deaths per 1,000 fire incidents is 2. This indicator was the highest - 10 in 2018, and the lowest 0 in 2002. The trend for fatalities per 1,000 fire incidents is rising. Compared to the New Jersey value the number of fatalities per 1,000 fires is higher.
 Based on the data from the years 2002 - 2018 the average number of fire-related yearly casualties is 8. The highest number of injuries - 20 took place in 2010, and the lowest - 0 in 2003. The data has a rising trend.
The average number of injuries per 1,000 fire incidents is 40. This indicator was the highest - 87 in 2008, and the lowest 0 in 2003. The trend for casualties per 1,000 incidents is increasing. Compared to the New Jersey value the number of injuries per 1,000 incidents is much higher.
Based on the data from the years 2002 - 2018 the average number of fire-related yearly casualties is 8. The highest number of injuries - 20 took place in 2010, and the lowest - 0 in 2003. The data has a rising trend.
The average number of injuries per 1,000 fire incidents is 40. This indicator was the highest - 87 in 2008, and the lowest 0 in 2003. The trend for casualties per 1,000 incidents is increasing. Compared to the New Jersey value the number of injuries per 1,000 incidents is much higher.Casualties per 1,000 incidents in Perth Amboy, NJ compared to nearest cities:
(Note: Based on data for all years, including only cities with at least 500 fire incidents)
| Perth Amboy: | 45.4 |
| Woodbridge: | 15.2 |
| South Amboy: | 13.2 |
| Avenel: | 4.7 |
| Iselin: | 5.1 |
| Sayreville: | 17.3 |
| Carteret: | 6.0 |
| Colonia: | 5.7 |
| Rahway: | 8.9 |
 31.2% incidents where reported in the morning and 68.8% in the evening. The most fires (15.5%) took place on Friday, and the least (12.1%) on Wednesday.
 Based on the 2,907 fire incident reports from years 2002 - 2018 most fires (10.0%) took place during April, and the least (5.9%) in September.
 Out of all 15,338 cases reported during the years 2002 - 2018, the most belonged to the categories: Hazardous Condition (36.1%), Rescue & EMS (19.7%), and Fire (19.0%).
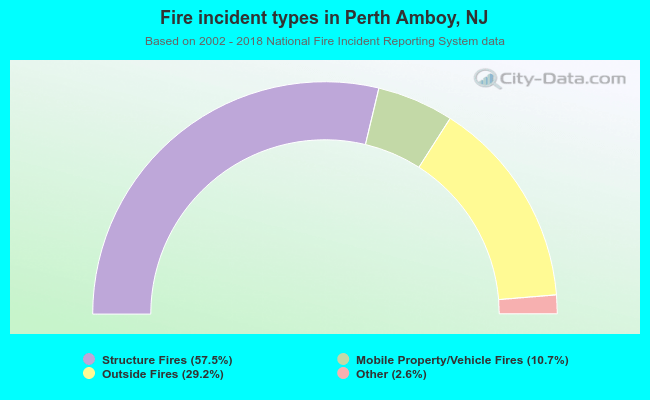 When looking into fire subcategories, the most incidents belonged to: Structure Fires (57.5%), and Outside Fires (29.2%).