Phelan: Fire Incidents, California (CA)
Where are fire incidents reported in Phelan, CA
Something went wrong! Please refresh the page.
|
| |||||||||||||||||||||||||||||||||||||||||||||||||||||||||||||||||||||||||||||||||||||||||||||||||||||||||||||
2005 - 2018 National Fire Incident Reporting System (NFIRS) incidents
- Incident types reported to NFIRS in Phelan, CA
- 1,55658.6%Rescue & EMS
- 45417.1%Fire
- 2258.5%Good Intent Call
- 1857.0%Service Call
- 1816.8%False Alarm
- 522.0%Hazardous Condition
- Fire incident types reported to NFIRS in Phelan, CA
- 36279.7%Outside Fires
- 4710.4%Structure Fires
- 296.4%Mobile Property/Vehicle Fires
- 163.5%Other
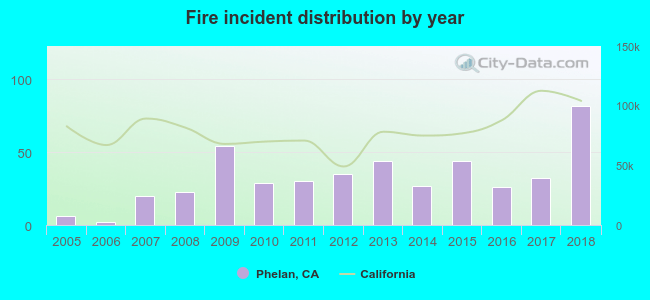 Based on the data from the years 2005 - 2018 the average number of fire incidents per year is 32. The highest number of fire incidents - 82 took place in 2018, and the least - 2 in 2006. The data has a rising trend.
The average number of yearly fire incidents per 10k residents in Phelan, CA compared to nearest cities:
(Note: Based on data for the last 3 years, including only cities with population 5,000 and above)
| Phelan: | 32.6 |
| Pinon Hills: | 11.0 |
| Oak Hills: | 2.8 |
| Adelanto: | 16.2 |
| Victorville: | 11.2 |
| Hesperia: | 10.4 |
| Spring Valley Lake: | 4.1 |
| Lake Los Angeles: | 46.5 |
| Crestline: | 13.3 |

 27.8% incidents where reported in the morning and 72.2% in the evening. The most fires (18.1%) took place on Saturday, and the least (11.9%) on Wednesday.
 Based on the 454 fire incidents from years 2005 - 2018 most fires (11.2%) took place during August, and the least (6.2%) in January.
 Out of all 2,656 cases reported during the years 2005 - 2018, the most belonged to the categories: Rescue & EMS (58.6%), Fire (17.1%), and Good Intent Call (8.5%).
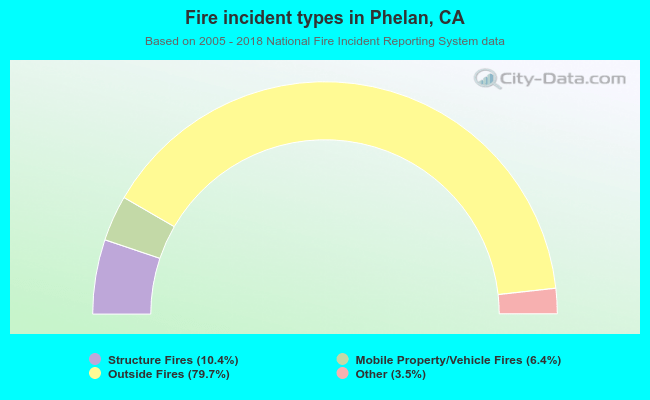 When looking into fire subcategories, the most reports belonged to: Outside Fires (79.7%), and Structure Fires (10.4%).