Pico Rivera: Fire Incidents, California (CA)
Where are fire incidents reported in Pico Rivera, CA
Something went wrong! Please refresh the page.
|
| |||||||||||||||||||||||||||||||||||||||||||||||||||||||||||||||||||||||||||||||||||||||||||||||||||||||||||||
2005 - 2018 National Fire Incident Reporting System (NFIRS) incidents
- Incident types reported to NFIRS in Pico Rivera, CA
- 15,28869.5%Rescue & EMS
- 3,43715.6%Good Intent Call
- 1,0834.9%False Alarm
- 9554.3%Fire
- 6873.1%Service Call
- 4932.2%Hazardous Condition
- 320.1%Special Incident
- Fire incident types reported to NFIRS in Pico Rivera, CA
- 43645.7%Outside Fires
- 23124.2%Mobile Property/Vehicle Fires
- 21922.9%Structure Fires
- 697.2%Other
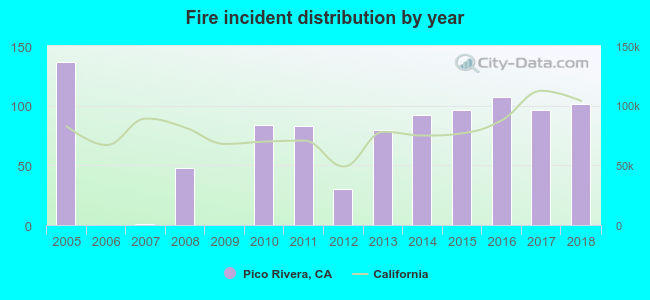 Based on the data from the years 2005 - 2018 the average number of fire incidents per year is 68. The highest number of fire incidents - 137 took place in 2005, and the least - 0 in 2006. The data has a declining trend.
The average number of yearly fire incidents per 10k residents in Pico Rivera, CA compared to nearest cities:
(Note: Based on data for the last 3 years, including only cities with population 5,000 and above)
| Pico Rivera: | 15.8 |
| Montebello: | 3.6 |
| Santa Fe Springs: | 47.1 |
| Commerce: | 70.9 |
| Whittier: | 11.9 |
| Bell Gardens: | 18.3 |
| South San Gabriel: | 12.4 |
| Downey: | 13.6 |
| South El Monte: | 26.1 |
 The median response time based on all reported fire incidents is 5 minutes. This is lower compared to the California median value.
The median response time in Pico Rivera, CA compared to nearest cities:
(Note: Based on data for all years, including only cities with at least 500 fire incidents)
| Pico Rivera: | 5 minutes |
| Montebello: | 7 minutes |
| Santa Fe Springs: | 7 minutes |
| Commerce: | 5 minutes |
| Whittier: | 4 minutes |
| Bell Gardens: | 5 minutes |
| Downey: | 7 minutes |
| Monterey Park: | 5 minutes |
| East Los Angeles: | 5 minutes |
 33.3% incidents where reported in the morning and 66.7% in the evening. The most fires (16.2%) took place on Wednesday, and the least (11.9%) on Friday.
 According to the 955 fire incident reports from years 2005 - 2018 most fires (10.8%) took place during January, and the least (6.1%) in October.
 Out of all 21,988 cases reported during the years 2005 - 2018, the most belonged to the categories: Rescue & EMS (69.5%), Good Intent Call (15.6%), and False Alarm (4.9%).
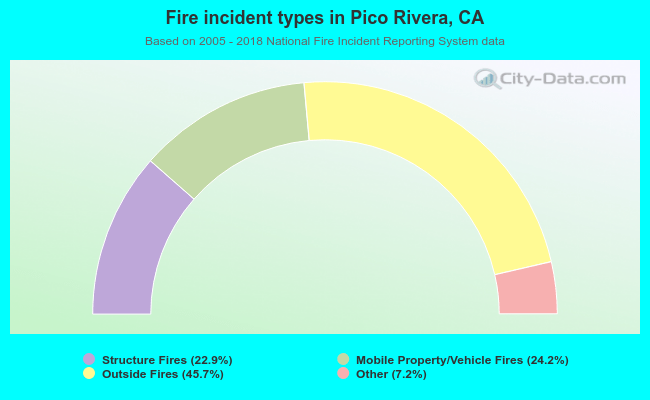 When looking into fire subcategories, the most incidents belonged to: Outside Fires (45.7%), and Mobile Property/Vehicle Fires (24.2%).