Pittsburg: Fire Incidents, California (CA)
Where are fire incidents reported in Pittsburg, CA
Something went wrong! Please refresh the page.
| Fire incidents reported | |
|---|---|
| Sreet name | Count |
| SR 4 | 202 |
| LELAND RD | 190 |
| HARBOR ST | 172 |
| LOVERIDGE RD | 170 |
| RAILROAD AVE | 166 |
| BAILEY RD | 104 |
| CENTURY BLVD | 90 |
| POWER AVE | 70 |
| PITTSBURG ANTIOCH HWY | 58 |
| 10TH ST | 46 |
| WILLOW PASS | 46 |
| 8TH ST | 44 |
| BUCHANAN RD | 44 |
| MARINA BLVD | 44 |
| SCHOOL ST | 44 |
| CALIFORNIA AVE | 42 |
| PARK BLVD | 42 |
| CRESTVIEW DR | 36 |
| FW 4 EB | 34 |
| KIRKER PASS | 34 |
| PARKSIDE DR | 30 |
| WILLIAM WAY | 30 |
| CENTRAL AVE | 28 |
| STONEMAN AVE | 26 |
| WEST BLVD | 26 |
| 12TH ST | 24 |
| BLISS AVE | 24 |
| LYNBROOK DR | 24 |
| EAST LELAND RD | 22 |
| GARCIA AVE | 22 |
| Other | 340 |
2005 - 2018 National Fire Incident Reporting System (NFIRS) incidents
- Incident types reported to NFIRS in Pittsburg, CA
- 8,19154.8%Rescue & EMS
- 2,81718.8%Good Intent Call
- 2,27415.2%Fire
- 7254.8%Hazardous Condition
- 5063.4%False Alarm
- 4402.9%Service Call
- Fire incident types reported to NFIRS in Pittsburg, CA
- 1,01944.8%Outside Fires
- 66429.2%Structure Fires
- 47921.1%Mobile Property/Vehicle Fires
- 1124.9%Other
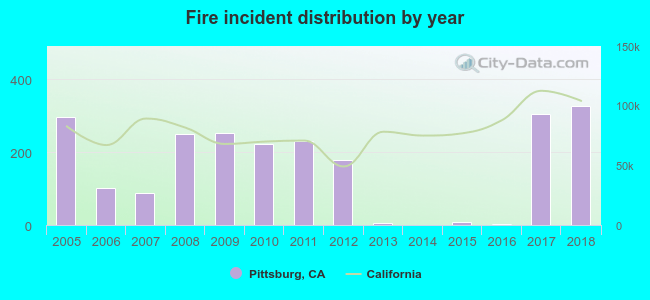 Based on the data from the years 2005 - 2018 the average number of fires per year is 162. The highest number of reported fires - 327 took place in 2018, and the least - 1 in 2014. The data has a growing trend.
The average number of yearly fire incidents per 10k residents in Pittsburg, CA compared to nearest cities:
(Note: Based on data for the last 3 years, including only cities with population 5,000 and above)
| Pittsburg: | 31.1 |
| Bay Point: | 54.3 |
| Antioch: | 36.2 |
| Clayton: | 19.4 |
| Concord: | 16.0 |
| Oakley: | 18.4 |
| Tassajara: | 1.3 |
| Pleasant Hill: | 25.1 |
| Walnut Creek: | 13.3 |
 The median response time based on all reported fire incidents is 6 minutes. This is similar to the California median value.
The median response time in Pittsburg, CA compared to nearest cities:
(Note: Based on data for all years, including only cities with at least 500 fire incidents)
| Pittsburg: | 6 minutes |
| Bay Point: | 7 minutes |
| Antioch: | 6 minutes |
| Concord: | 6 minutes |
| Oakley: | 7 minutes |
| Pleasant Hill: | 6 minutes |
| Walnut Creek: | 6 minutes |
| Brentwood: | 7 minutes |
| Martinez: | 7 minutes |
 34.5% incidents where reported in the morning and 65.5% in the evening. The most fires (15.7%) took place on Sunday, and the least (12.7%) on Friday.
 According to the 2,274 incident reports from years 2005 - 2018 most fires (14.6%) took place during July, and the least (5.3%) in November.
 Out of all 14,960 cases reported during the years 2005 - 2018, the most belonged to the categories: Rescue & EMS (54.8%), Good Intent Call (18.8%), and Fire (15.2%).
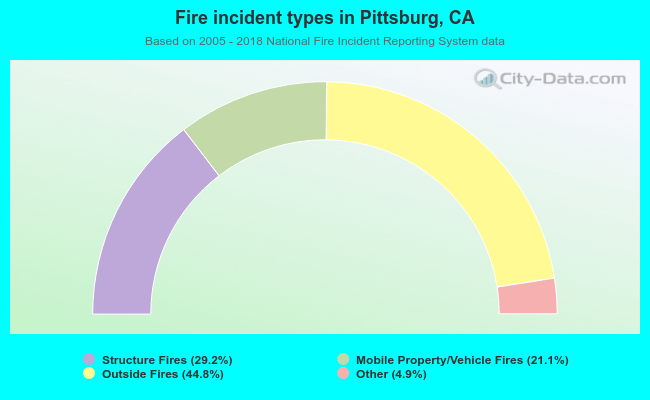 When looking into fire subcategories, the most reports belonged to: Outside Fires (44.8%), and Structure Fires (29.2%).