Pittston: Fire Incidents, Pennsylvania (PA)
Where are fire incidents reported in Pittston, PA
Something went wrong! Please refresh the page.
|
| |||||||||||||||||||||||||||||||||||||||||||||||||||||||||||||||||||||||||||||||||||||||||||||||||||||||||||||
2005 - 2018 National Fire Incident Reporting System (NFIRS) incidents
- Incident types reported to NFIRS in Pittston, PA
- 76437.4%Rescue & EMS
- 37418.3%Service Call
- 28714.0%False Alarm
- 26513.0%Good Intent Call
- 1768.6%Fire
- 1246.1%Hazardous Condition
- 462.3%Special Incident
- 40.2%Overpressure Rupture
- 40.2%Severe Weather
- Fire incident types reported to NFIRS in Pittston, PA
- 11464.8%Structure Fires
- 3922.2%Outside Fires
- 148.0%Other
- 95.1%Mobile Property/Vehicle Fires
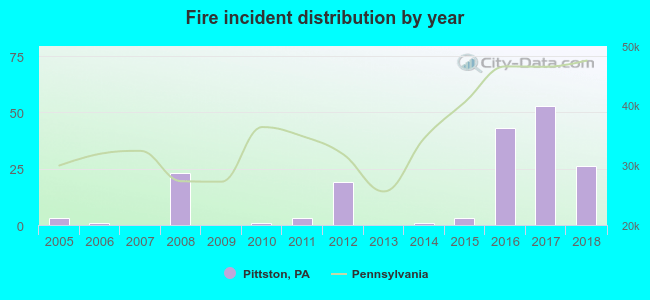 According to the data from the years 2005 - 2018 the average number of fire incidents per year is 13. The highest number of reported fire incidents - 53 took place in 2017, and the least - 0 in 2007. The data has a rising trend.
The average number of yearly fire incidents per 10k residents in Pittston, PA compared to nearest cities:
(Note: Based on data for the last 3 years, including only cities with population 5,000 and above)
| Pittston: | 52.9 |
| Exeter: | 58.3 |
| Old Forge: | 33.3 |
| Moosic: | 42.2 |
| Swoyersville: | 4.7 |
| Taylor: | 4.9 |
| Kingston: | 57.5 |
| Scranton: | 21.6 |
| Plymouth: | 23.3 |
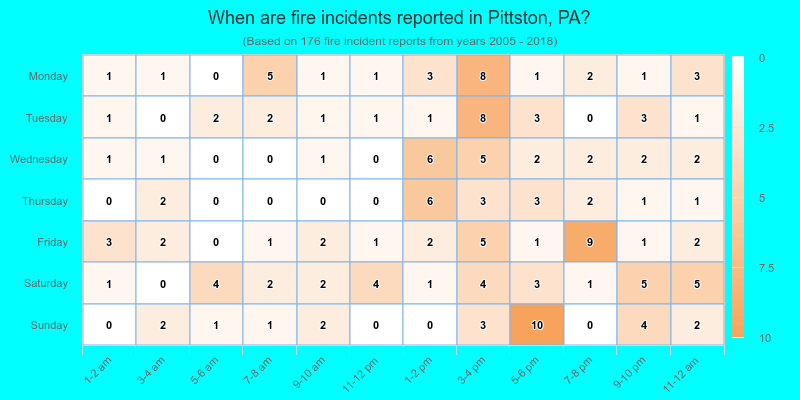
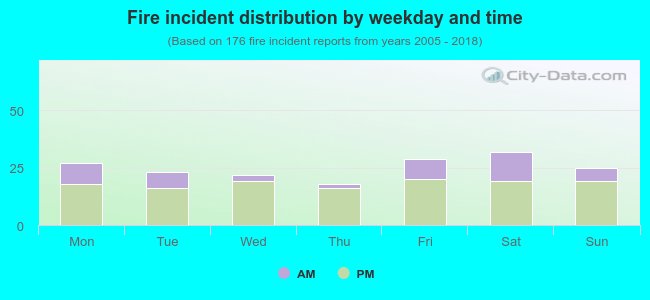 27.8% incidents where reported in the morning and 72.2% in the evening. The most fires (18.2%) took place on Saturday, and the least (10.2%) on Thursday.
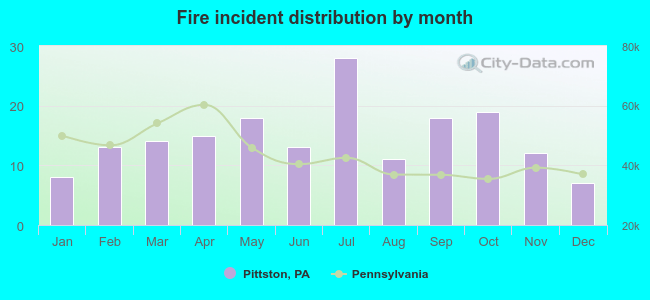 According to the 176 fire incidents from years 2005 - 2018 most fires (15.9%) took place during July, and the least (4.0%) in December.
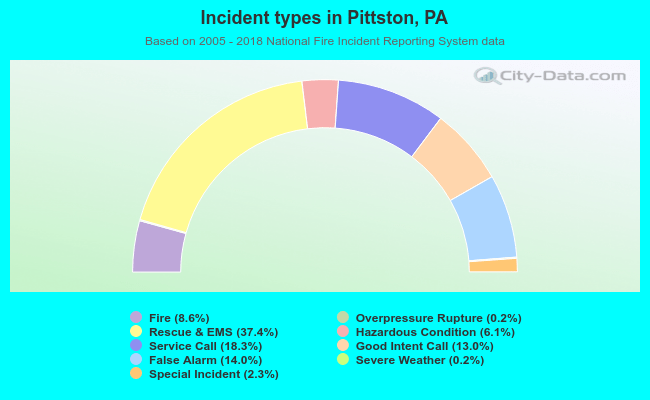 Out of all 2,044 cases reported during the years 2005 - 2018, the most belonged to the categories: Rescue & EMS (37.4%), Service Call (18.3%), and False Alarm (14.0%).
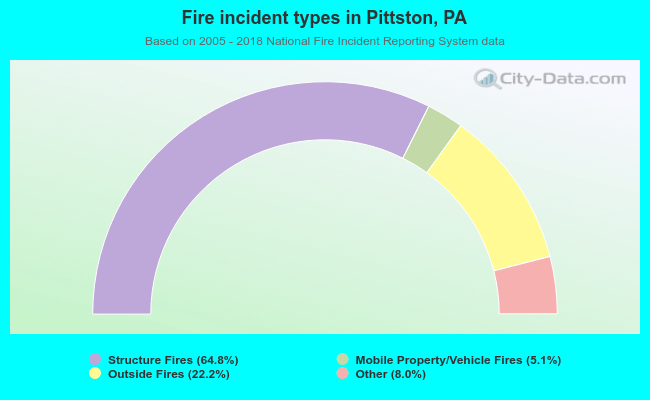 When looking into fire subcategories, the most incidents belonged to: Structure Fires (64.8%), and Outside Fires (22.2%).