Pixley: Fire Incidents, California (CA)
Where are fire incidents reported in Pixley, CA
Something went wrong! Please refresh the page.
|
| |||||||||||||||||||||||||||||||||||||||||||||||||||||||||||||||||||||||||||||||||||||||||||||||||||||||||||||
2005 - 2018 National Fire Incident Reporting System (NFIRS) incidents
- Incident types reported to NFIRS in Pixley, CA
- 95657.1%Rescue & EMS
- 36021.5%Fire
- 1408.4%Good Intent Call
- 955.7%Service Call
- 794.7%Hazardous Condition
- 352.1%False Alarm
- 90.5%Special Incident
- Fire incident types reported to NFIRS in Pixley, CA
- 19253.3%Outside Fires
- 9827.2%Mobile Property/Vehicle Fires
- 5615.6%Structure Fires
- 143.9%Other
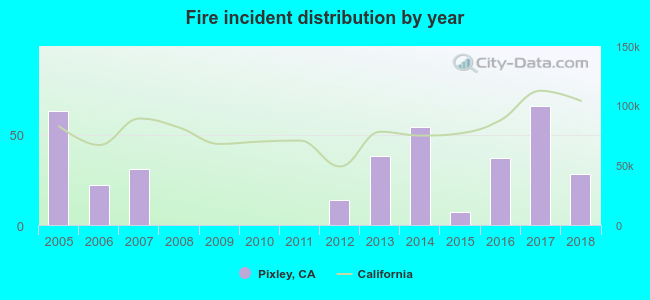 According to the data from the years 2005 - 2018 the average number of fires per year is 26. The highest number of fires - 66 took place in 2017, and the least - 0 in 2008. The data has a dropping trend.
 35.0% incidents where reported in the morning and 65.0% in the evening. The most fires (17.8%) took place on Saturday, and the least (11.7%) on Thursday.
 According to the 360 fire incidents from years 2005 - 2018 most fires (15.8%) took place during June, and the least (4.2%) in February.
 Out of all 1,675 cases reported during the years 2005 - 2018, the most belonged to the categories: Rescue & EMS (57.1%), Fire (21.5%), and Good Intent Call (8.4%).
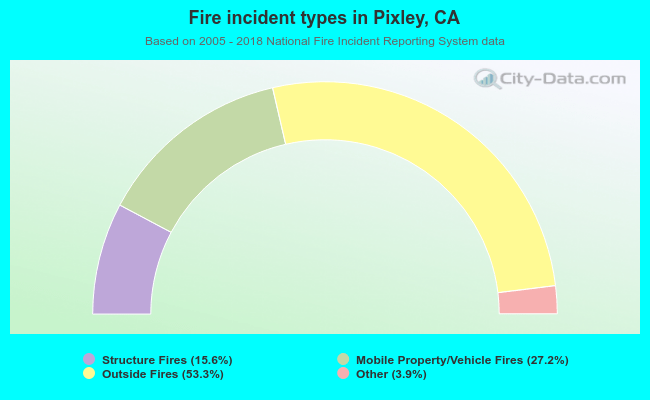 When looking into fire subcategories, the most reports belonged to: Outside Fires (53.3%), and Mobile Property/Vehicle Fires (27.2%).