Plymouth: Fire Incidents, New Hampshire (NH)
Where are fire incidents reported in Plymouth, NH
Something went wrong! Please refresh the page.
| Fire incidents reported | |
|---|---|
| Sreet name | Count |
| RUSSELL ST | 160 |
| MAIN ST | 100 |
| HIGHLAND ST | 88 |
| PLEASANT ST | 82 |
| TENNEY MOUNTAIN HWY | 64 |
| MERRILL ST | 58 |
| WINTER ST | 50 |
| HIGH ST | 44 |
| LANGDON ST | 42 |
| TEXAS HILL RD | 42 |
| FAIRGROUNDS RD | 34 |
| DANIEL WEBSTER HWY | 32 |
| MAYHEW TPKE | 30 |
| FOX PARK DR | 20 |
| HIGHLAND AVE | 20 |
| COOKSVILLE RD | 18 |
| RESERVOIR RD | 16 |
| CRAWFORD ST | 14 |
| GREEN ST | 14 |
| PINE GATE RD | 14 |
| WENTWORTH ST | 14 |
| RAILROAD SQ | 12 |
| RIVER RD | 12 |
| RIVERSIDE DR | 12 |
| TENNEY MOUNTAIN RD | 12 |
| SCHOOL ST | 10 |
| TAMARAC PL | 10 |
| BARTLETT RD | 8 |
| BEECH HILL RD | 8 |
| CARMEL DR | 8 |
2002 - 2018 National Fire Incident Reporting System (NFIRS) incidents
- Incident types reported to NFIRS in Plymouth, NH
- 2,82947.7%Rescue & EMS
- 81413.7%False Alarm
- 76012.8%Fire
- 67911.4%Hazardous Condition
- 4377.4%Good Intent Call
- 3616.1%Service Call
- 470.8%Overpressure Rupture
- Fire incident types reported to NFIRS in Plymouth, NH
- 34345.1%Outside Fires
- 33844.5%Structure Fires
- 557.2%Mobile Property/Vehicle Fires
- 243.2%Other
 Based on the data from the years 2002 - 2018 the average number of fire incidents per year is 45. The highest number of reported fire incidents - 66 took place in 2011, and the least - 26 in 2018. The data has a declining trend.
 The median response time based on all reported fire incidents is 5 minutes. This is lower than the New Hampshire median value.
The median response time in Plymouth, NH compared to nearest cities:
(Note: Based on data for all years, including only cities with at least 500 fire incidents)
| Plymouth: | 5 minutes |
| Campton: | 12 minutes |
| Meredith: | 7 minutes |
| Sanbornton: | 12 minutes |
| Laconia: | 6 minutes |
| Gilford: | 8 minutes |
| Tilton: | 7 minutes |
| Franklin: | 7 minutes |
| Belmont: | 9 minutes |
 45.4% incidents where reported in the morning and 54.6% in the evening. The most fires (17.9%) took place on Friday, and the least (8.9%) on Wednesday.
 According to the 760 reports from years 2002 - 2018 most fires (23.6%) took place during May, and the least (3.8%) in March.
 Out of all 5,933 cases reported during the years 2002 - 2018, the most belonged to the categories: Rescue & EMS (47.7%), False Alarm (13.7%), and Fire (12.8%).
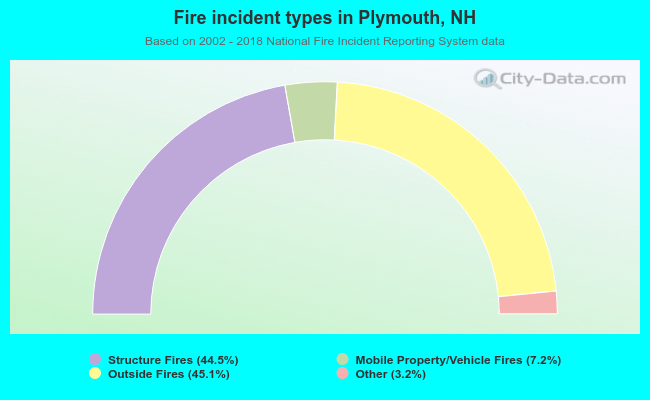 When looking into fire subcategories, the most incidents belonged to: Outside Fires (45.1%), and Structure Fires (44.5%).