Price: Fire Incidents, Utah (UT)
Where are fire incidents reported in Price, UT
Something went wrong! Please refresh the page.
|
| |||||||||||||||||||||||||||||||||||||||||||||||||||||||||||||||||||||||||||||||||||||||||||||||||||||||||||||
| Other | 354 | |||||||||||||||||||||||||||||||||||||||||||||||||||||||||||||||||||||||||||||||||||||||||||||||||||||||||||||
2002 - 2018 National Fire Incident Reporting System (NFIRS) incidents
- Incident types reported to NFIRS in Price, UT
- 2,02546.7%Rescue & EMS
- 90420.8%Fire
- 58413.5%False Alarm
- 53512.3%Hazardous Condition
- 2435.6%Good Intent Call
- 330.8%Service Call
- 110.3%Severe Weather
- Fire incident types reported to NFIRS in Price, UT
- 41946.3%Outside Fires
- 34638.3%Structure Fires
- 10111.2%Mobile Property/Vehicle Fires
- 384.2%Other
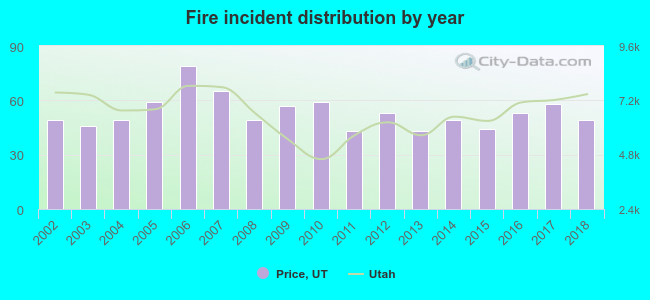 Based on the data from the years 2002 - 2018 the average number of fires per year is 53. The highest number of fires - 79 took place in 2006, and the least - 43 in 2011. The data has a constant trend.
The average number of yearly fire incidents per 10k residents in Price, UT compared to nearest cities:
(Note: Based on data for the last 3 years, including only cities with population 5,000 and above)
| Price: | 63.8 |
| Ephraim: | 27.3 |
| Nephi: | 53.3 |
| Mapleton: | 7.3 |
| Salem: | 27.2 |
| Spanish Fork: | 15.4 |
| Springville: | 15.4 |
| Payson: | 36.7 |
| Santaquin: | 25.7 |
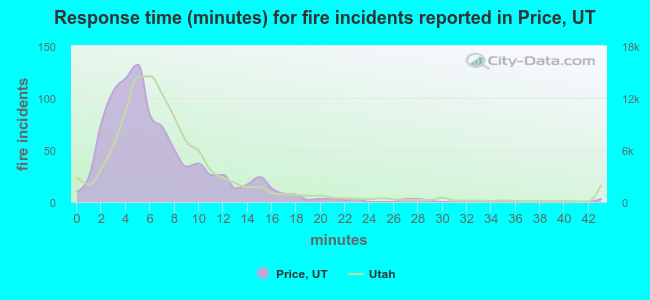 The median response time based on all reported fire incidents is 5 minutes. This is lower than the Utah median value.
The median response time in Price, UT compared to nearest cities:
(Note: Based on data for all years, including only cities with at least 500 fire incidents)
| Price: | 5 minutes |
| Nephi: | 11 minutes |
| Spanish Fork: | 8 minutes |
| Springville: | 6 minutes |
| Payson: | 8 minutes |
| Provo: | 6 minutes |
| Roosevelt: | 11 minutes |
| Orem: | 5 minutes |
| Pleasant Grove: | 6 minutes |
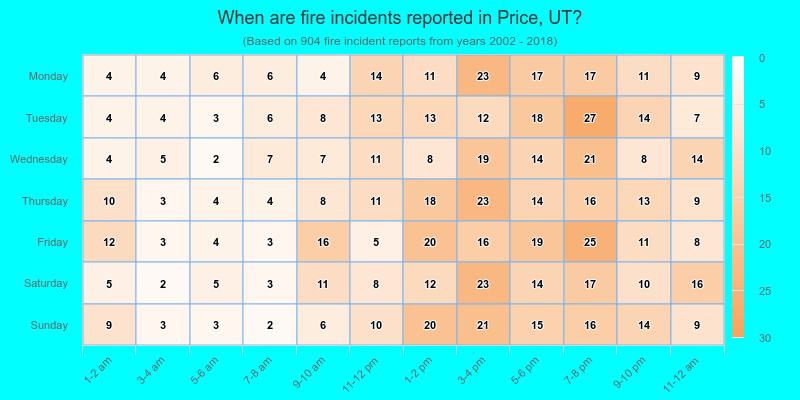
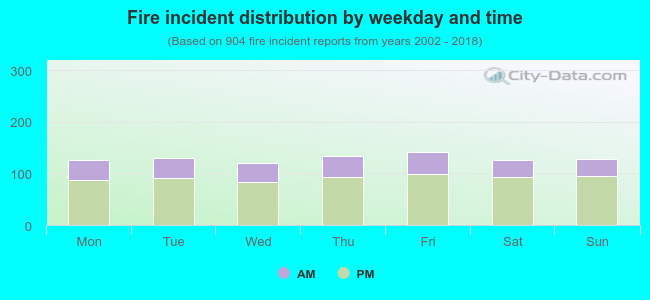 29.0% incidents where reported in the morning and 71.0% in the evening. The most fires (15.7%) took place on Friday, and the least (13.3%) on Wednesday.
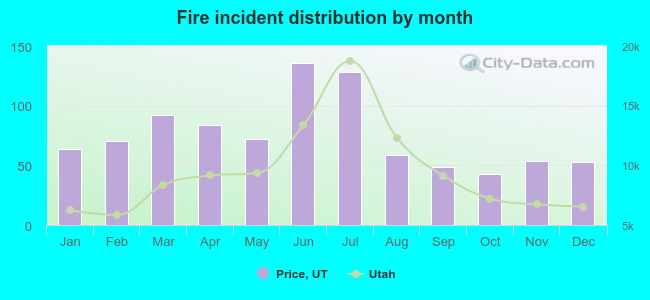 Based on the 904 fire incidents from years 2002 - 2018 most fires (15.0%) took place during June, and the least (4.8%) in October.
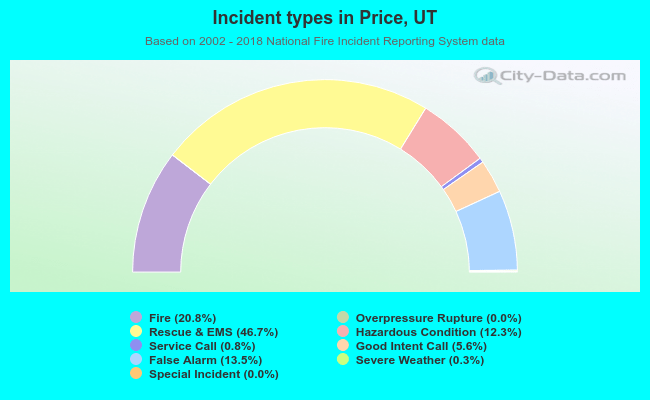 Out of all 4,339 cases reported during the years 2002 - 2018, the most belonged to the categories: Rescue & EMS (46.7%), Fire (20.8%), and False Alarm (13.5%).
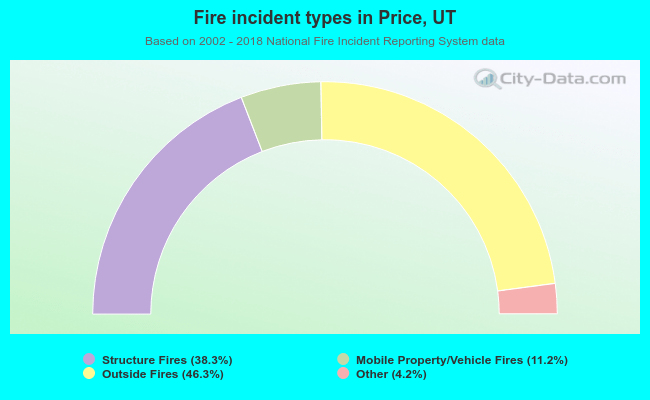 When looking into fire subcategories, the most incidents belonged to: Outside Fires (46.3%), and Structure Fires (38.3%).