Raymore: Fire Incidents, Missouri (MO)
Where are fire incidents reported in Raymore, MO
Something went wrong! Please refresh the page.
| Fire incidents reported | |
|---|---|
| Sreet name | Count |
| FOXWOOD DR | 88 |
| MOTT DR | 44 |
| WALNUT ST | 44 |
| MADISON ST | 40 |
| 58 HWY | 36 |
| KURZWEIL RD | 36 |
| SCHOOL RD | 36 |
| LUCY WEBB RD | 30 |
| LYNE AVE | 30 |
| FOXWOOD | 26 |
| SUNRISE DR | 24 |
| 195TH ST | 22 |
| MULLEN AVE | 22 |
| PRAIRIE LN | 20 |
| FOXRIDGE DR | 18 |
| J HWY | 18 |
| FREDERICK LN | 16 |
| HUBACH HILL RD | 16 |
| JERRY AVE | 16 |
| FRANKLIN | 14 |
| 195 ST | 12 |
| 291 HWY | 12 |
| CALICO DR | 12 |
| JERRY | 12 |
| JOHNSTON DR | 12 |
| MORRISON RD | 12 |
| PINE ST | 12 |
| WARD RD | 12 |
| WASHINGTON | 12 |
| BROOKSIDE PL | 10 |
| Other | 162 |
2002 - 2018 National Fire Incident Reporting System (NFIRS) incidents
- Incident types reported to NFIRS in Raymore, MO
- 3,42046.9%Rescue & EMS
- 1,75524.0%Service Call
- 87612.0%Fire
- 5998.2%Hazardous Condition
- 3845.3%Good Intent Call
- 2493.4%False Alarm
- 90.1%Special Incident
- Fire incident types reported to NFIRS in Raymore, MO
- 41247.0%Structure Fires
- 34639.5%Outside Fires
- 9811.2%Mobile Property/Vehicle Fires
- 202.3%Other
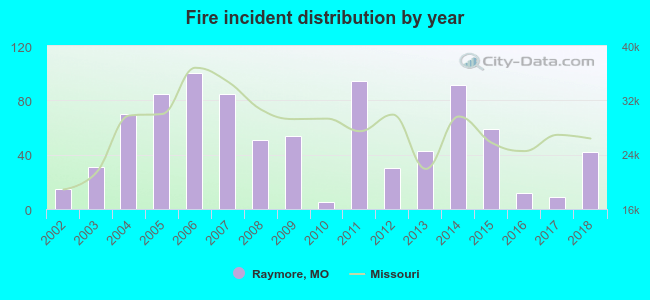 Based on the data from the years 2002 - 2018 the average number of fire incidents per year is 52. The highest number of fires - 100 took place in 2006, and the least - 5 in 2010. The data has a growing trend.
The average number of yearly fire incidents per 10k residents in Raymore, MO compared to nearest cities:
(Note: Based on data for the last 3 years, including only cities with population 5,000 and above)
| Raymore: | 10.5 |
| Belton: | 34.0 |
| Grandview: | 44.0 |
| Greenwood: | 23.1 |
| Pleasant Hill: | 32.7 |
| Harrisonville: | 7.0 |
| Raytown: | 6.4 |
| Blue Springs: | 19.5 |
| Independence: | 40.0 |
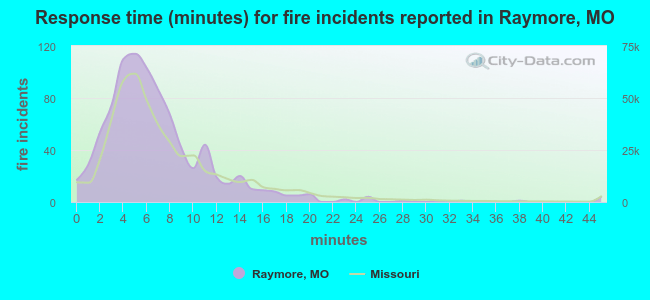 The median response time based on all reported fire incidents is 6 minutes. This is close to the Missouri median value.
The median response time in Raymore, MO compared to nearest cities:
(Note: Based on data for all years, including only cities with at least 500 fire incidents)
| Raymore: | 6 minutes |
| Belton: | 6 minutes |
| Peculiar: | 8 minutes |
| Grandview: | 5 minutes |
| Lee's Summit: | 6 minutes |
| Pleasant Hill: | 8 minutes |
| Leawood: | 5 minutes |
| Harrisonville: | 7 minutes |
| Raytown: | 5 minutes |
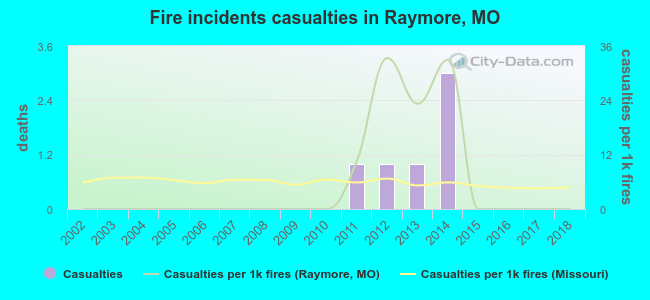 Based on the data from the years 2002 - 2018 the average number of fire-related casualties per year is 0. The highest number of reported casualties - 3 took place in 2014, and the lowest - 0 in 2002. The data has a constant trend.
The average number of injuries per 1,000 fire incidents is 6. This indicator was the highest - 33 in 2012, and the lowest 0 in 2002. The trend for injuries per 1,000 fires is constant. Compared to the state value the number of injuries per 1,000 fire incidents is similar.
Based on the data from the years 2002 - 2018 the average number of fire-related casualties per year is 0. The highest number of reported casualties - 3 took place in 2014, and the lowest - 0 in 2002. The data has a constant trend.
The average number of injuries per 1,000 fire incidents is 6. This indicator was the highest - 33 in 2012, and the lowest 0 in 2002. The trend for injuries per 1,000 fires is constant. Compared to the state value the number of injuries per 1,000 fire incidents is similar.Casualties per 1,000 incidents in Raymore, MO compared to nearest cities:
(Note: Based on data for all years, including only cities with at least 500 fire incidents)
| Raymore: | 6.8 |
| Belton: | 14.5 |
| Peculiar: | 8.4 |
| Grandview: | 40.2 |
| Lee's Summit: | 1.6 |
| Pleasant Hill: | 13.8 |
| Leawood: | 8.3 |
| Harrisonville: | 23.7 |
| Raytown: | 1.5 |
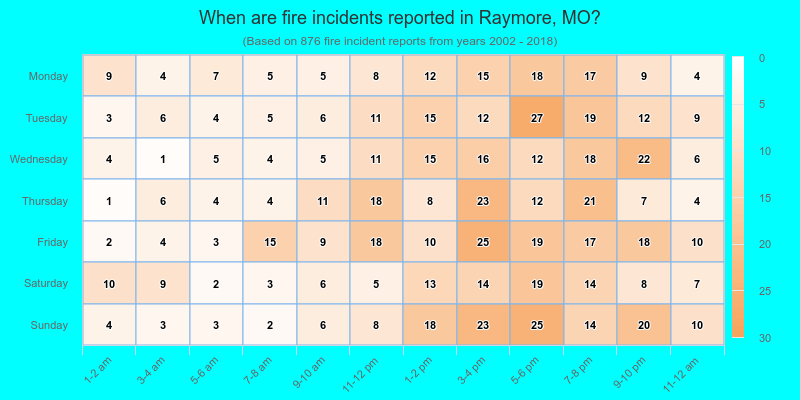
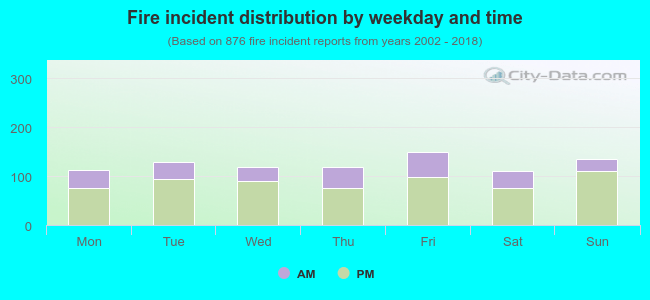 29.6% incidents where reported in the morning and 70.4% in the evening. The most fires (17.1%) took place on Friday, and the least (12.6%) on Saturday.
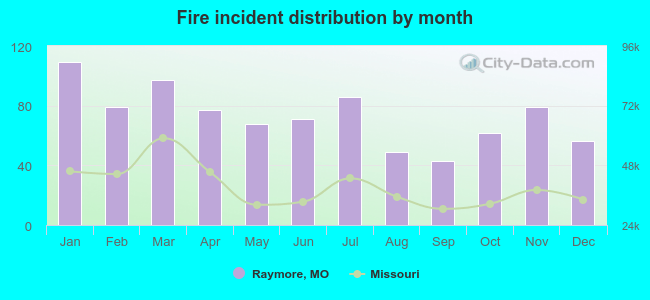 According to the 876 fires from years 2002 - 2018 most fires (12.4%) took place during January, and the least (4.9%) in September.
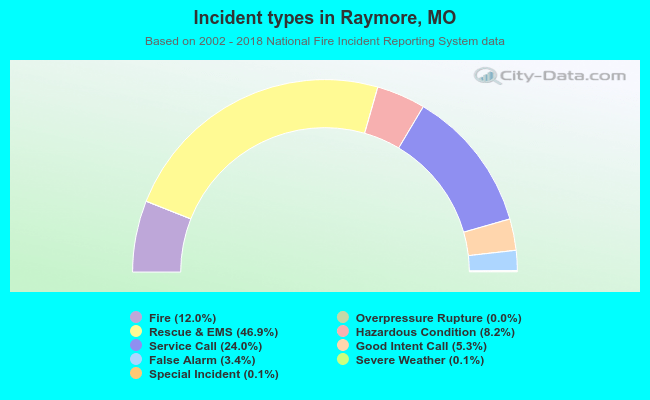 Out of all 7,298 cases reported during the years 2002 - 2018, the most belonged to the categories: Rescue & EMS (46.9%), Service Call (24.0%), and Fire (12.0%).
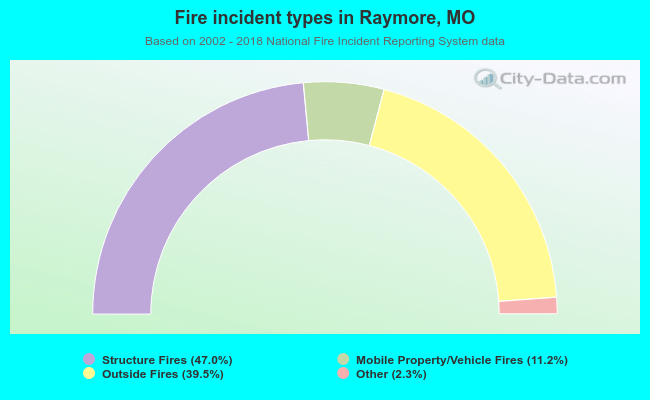 When looking into fire subcategories, the most reports belonged to: Structure Fires (47.0%), and Outside Fires (39.5%).