Redlands: Fire Incidents, California (CA)
Where are fire incidents reported in Redlands, CA
Something went wrong! Please refresh the page.
| Fire incidents reported | |
|---|---|
| Sreet name | Count |
| REDLANDS BLVD | 248 |
| LUGONIA AVE | 236 |
| COLTON AVE | 218 |
| ORANGE ST | 192 |
| ALABAMA ST | 166 |
| SAN BERNARDINO AVE | 128 |
| CITRUS AVE | 120 |
| BARTON RD | 96 |
| SUNSET DR | 90 |
| BROOKSIDE AVE | 88 |
| CHURCH ST | 88 |
| EB I10 | 82 |
| PIONEER AVE | 82 |
| TENNESSEE ST | 82 |
| BROCKTON AVE | 80 |
| STATE ST | 78 |
| NEW YORK ST | 68 |
| NEVADA ST | 66 |
| 6TH ST | 60 |
| POST ST | 60 |
| ALTA ST | 58 |
| OXFORD DR | 58 |
| PENNSYLVANIA AVE | 58 |
| LIVE OAK CANYON RD | 56 |
| CAJON ST | 54 |
| CYPRESS AVE | 54 |
| OLIVE AVE | 54 |
| CENTRAL AVE | 52 |
| JUDSON ST | 52 |
| CALIFORNIA ST | 50 |
| Other | 611 |
2005 - 2018 National Fire Incident Reporting System (NFIRS) incidents
- Incident types reported to NFIRS in Redlands, CA
- 24,18257.6%Rescue & EMS
- 4,97411.9%Good Intent Call
- 3,8859.3%Hazardous Condition
- 3,5238.4%Service Call
- 3,4858.3%Fire
- 1,6453.9%False Alarm
- 1440.3%Overpressure Rupture
- 1300.3%Special Incident
- Fire incident types reported to NFIRS in Redlands, CA
- 1,56644.9%Outside Fires
- 1,04029.8%Structure Fires
- 78022.4%Mobile Property/Vehicle Fires
- 992.8%Other
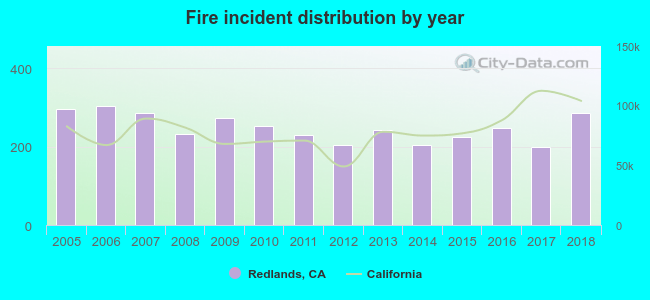 Based on the data from the years 2005 - 2018 the average number of fire incidents per year is 249. The highest number of reported fires - 305 took place in 2006, and the least - 199 in 2017. The data has a dropping trend.
The average number of yearly fire incidents per 10k residents in Redlands, CA compared to nearest cities:
(Note: Based on data for the last 3 years, including only cities with population 5,000 and above)
| Redlands: | 34.5 |
| Mentone: | 16.8 |
| Loma Linda: | 30.9 |
| Highland: | 2.4 |
| Yucaipa: | 2.6 |
| Grand Terrace: | 8.3 |
| San Bernardino: | 22.7 |
| Colton: | 60.0 |
| Calimesa: | 15.8 |
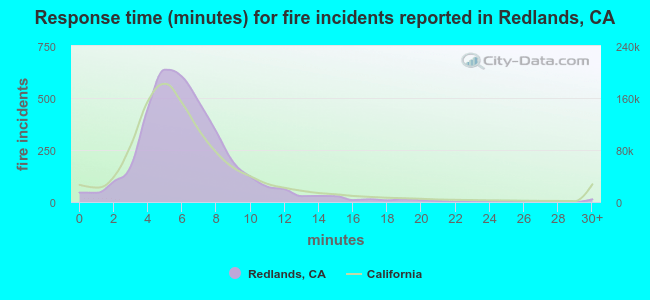 The median response time based on all reported fire incidents is 6 minutes. This is close to the state median value.
The median response time in Redlands, CA compared to nearest cities:
(Note: Based on data for all years, including only cities with at least 500 fire incidents)
| Redlands: | 6 minutes |
| Loma Linda: | 6 minutes |
| San Bernardino: | 7 minutes |
| Colton: | 7 minutes |
| Rialto: | 8 minutes |
| Riverside: | 6 minutes |
| Fontana: | 7 minutes |
| Rancho Cucamonga: | 7 minutes |
| Hemet: | 6 minutes |
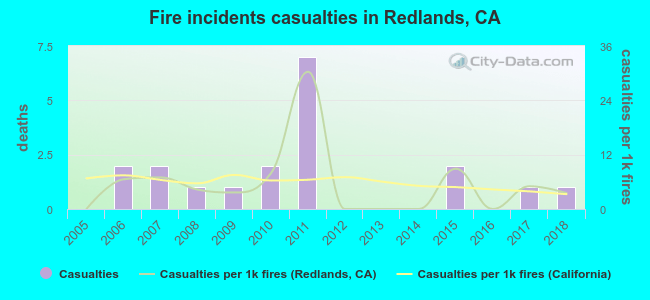 According to the data from the years 2005 - 2018 the average number of fire-related casualties per year is 1. The highest number of injuries - 7 took place in 2011, and the lowest - 0 in 2005. The data has a rising trend.
The average number of casualties per 1,000 fires is 6. This indicator was the highest - 30 in 2011, and the lowest 0 in 2005. The trend for injuries per 1,000 fires is growing. Compared to the California value the number of casualties per 1,000 incidents is about the same.
According to the data from the years 2005 - 2018 the average number of fire-related casualties per year is 1. The highest number of injuries - 7 took place in 2011, and the lowest - 0 in 2005. The data has a rising trend.
The average number of casualties per 1,000 fires is 6. This indicator was the highest - 30 in 2011, and the lowest 0 in 2005. The trend for injuries per 1,000 fires is growing. Compared to the California value the number of casualties per 1,000 incidents is about the same.Casualties per 1,000 incidents in Redlands, CA compared to nearest cities:
(Note: Based on data for all years, including only cities with at least 500 fire incidents)
| Redlands: | 5.5 |
| Loma Linda: | 5.9 |
| San Bernardino: | 4.3 |
| Colton: | 4.0 |
| Rialto: | 14.3 |
| Riverside: | 23.0 |
| Fontana: | 2.1 |
| Rancho Cucamonga: | 15.6 |
| Hemet: | 11.0 |
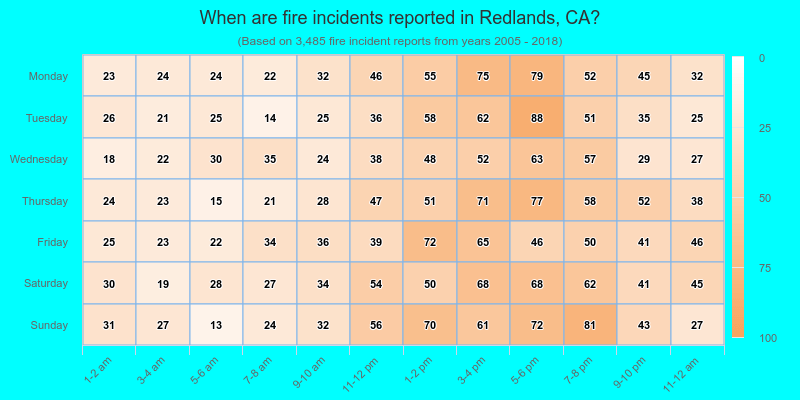
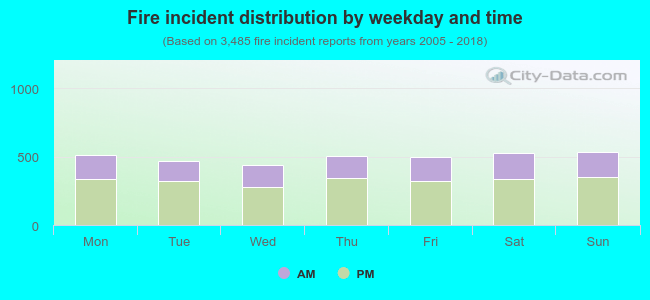 34.3% incidents where reported in the morning and 65.7% in the evening. The most fires (15.4%) took place on Sunday, and the least (12.7%) on Wednesday.
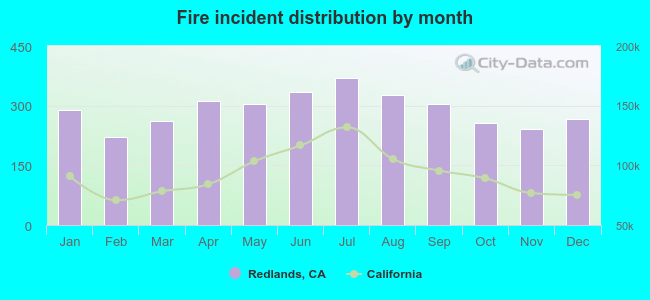 Based on the 3,485 reports from years 2005 - 2018 most fires (10.6%) took place during July, and the least (6.3%) in February.
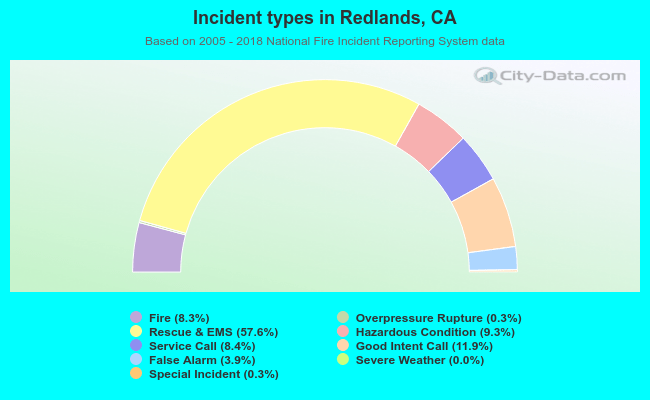 Out of all 41,971 cases reported during the years 2005 - 2018, the most belonged to the categories: Rescue & EMS (57.6%), Good Intent Call (11.9%), and Hazardous Condition (9.3%).
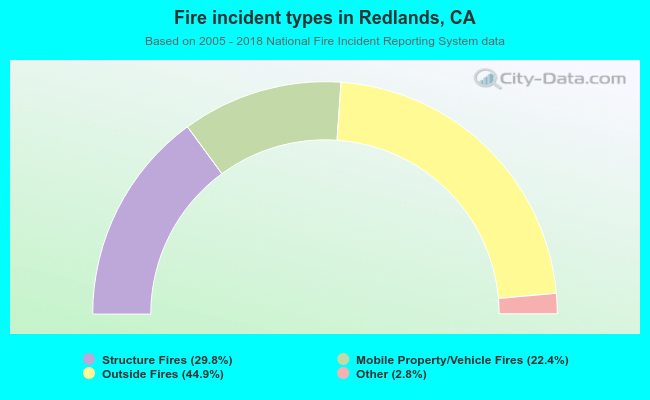 When looking into fire subcategories, the most reports belonged to: Outside Fires (44.9%), and Structure Fires (29.8%).