Rehoboth Beach: Fire Incidents, Delaware (DE)
Where are fire incidents reported in Rehoboth Beach, DE
Something went wrong! Please refresh the page.
|
| |||||||||||||||||||||||||||||||||||||||||||||||||||||||||||||||||||||||||||||||||||||||||||||||||||||||||||||
| Other | 91 | |||||||||||||||||||||||||||||||||||||||||||||||||||||||||||||||||||||||||||||||||||||||||||||||||||||||||||||
2002 - 2018 National Fire Incident Reporting System (NFIRS) incidents
- Incident types reported to NFIRS in Rehoboth Beach, DE
- 97826.4%Hazardous Condition
- 79021.3%False Alarm
- 78121.0%Fire
- 60416.3%Rescue & EMS
- 3439.2%Service Call
- 1975.3%Good Intent Call
- 90.2%Overpressure Rupture
- 60.2%Severe Weather
- Fire incident types reported to NFIRS in Rehoboth Beach, DE
- 40952.4%Structure Fires
- 26033.3%Outside Fires
- 9011.5%Mobile Property/Vehicle Fires
- 222.8%Other
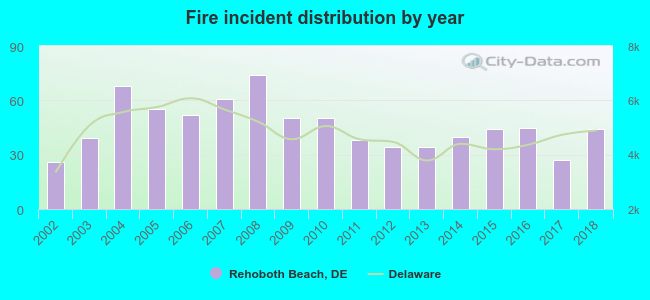 Based on the data from the years 2002 - 2018 the average number of fires per year is 46. The highest number of reported fires - 74 took place in 2008, and the least - 26 in 2002. The data has a rising trend.
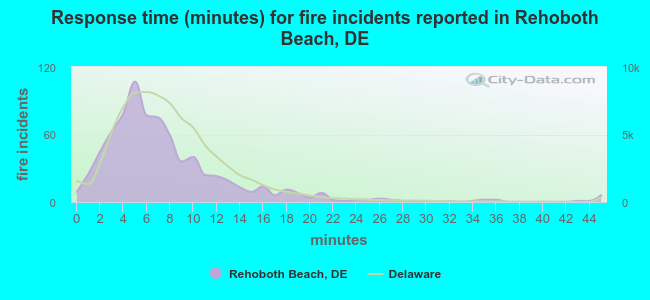 The median response time based on all reported fire incidents is 6 minutes. This is comparable to the state median value.
The median response time in Rehoboth Beach, DE compared to nearest cities:
(Note: Based on data for all years, including only cities with at least 500 fire incidents)
| Rehoboth Beach: | 6 minutes |
| Lewes: | 8 minutes |
| Bethany Beach: | 7 minutes |
| Millsboro: | 9 minutes |
| Dagsboro: | 9 minutes |
| Frankford: | 8 minutes |
| Georgetown: | 9 minutes |
| Milford: | 9 minutes |
| Bridgeville: | 9 minutes |
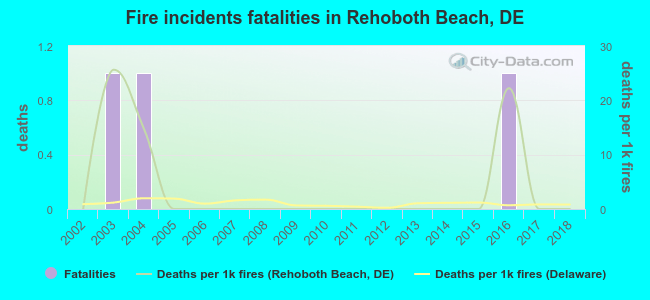 Based on the reports from the years 2002 - 2018 the average number of fire-related yearly deaths is 0. The highest number of deaths - 1 took place in 2003, and the lowest - 0 in 2002. The data has a constant trend.
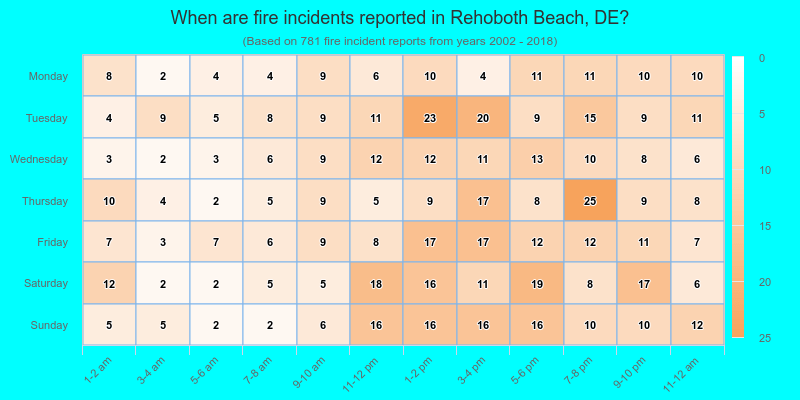
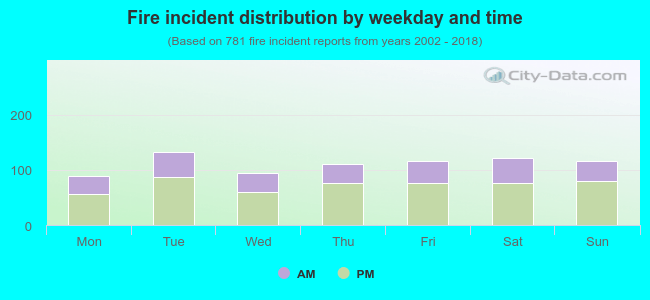 34.4% incidents where reported in the morning and 65.6% in the evening. The most fires (17.0%) took place on Tuesday, and the least (11.4%) on Monday.
 Based on the 781 incident reports from years 2002 - 2018 most fires (12.7%) took place during July, and the least (5.0%) in November.
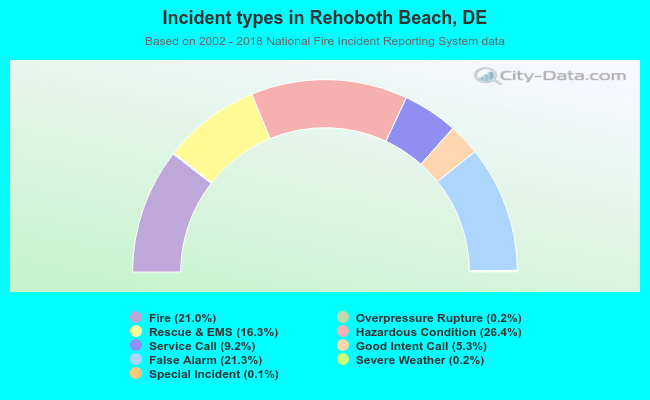 Out of all 3,711 cases reported during the years 2002 - 2018, the most belonged to the categories: Hazardous Condition (26.4%), False Alarm (21.3%), and Fire (21.0%).
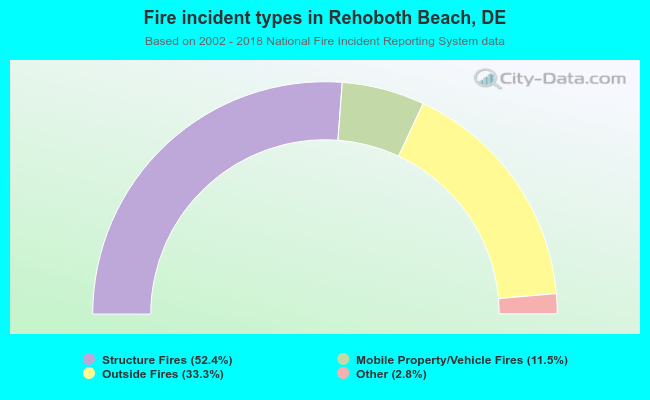 When looking into fire subcategories, the most incidents belonged to: Structure Fires (52.4%), and Outside Fires (33.3%).