Richmond: Fire Incidents, Kentucky (KY)
Where are fire incidents reported in Richmond, KY
Something went wrong! Please refresh the page.
| Fire incidents reported | |
|---|---|
| Sreet name | Count |
| LEXINGTON RD | 200 |
| EASTERN BYPASS HWY | 196 |
| IRVINE RD | 148 |
| CHARLIE NORRIS RD | 146 |
| GREENS CROSSING RD | 144 |
| BARNES MILL RD | 136 |
| MAIN ST | 136 |
| I-75 FWY | 126 |
| RED HOUSE RD | 114 |
| TATES CREEK RD | 114 |
| EASTERN BYP | 112 |
| BEREA RD | 104 |
| BIG HILL AVE | 88 |
| MADISON AVE | 84 |
| JACKS CREEK RD | 82 |
| KEENELAND DR | 80 |
| MAPLE GROVE RD | 78 |
| CONCORD RD | 72 |
| IRVINE ST | 66 |
| LANTERN RIDGE DR | 66 |
| KIRKSVILLE RD | 64 |
| THIRD ST | 64 |
| STONEY RUN RD | 62 |
| COLONEL RD | 58 |
| LANCASTER RD | 58 |
| POOSEY RIDGE RD | 58 |
| UNION CITY RD | 58 |
| OAKLEY WELLS RD | 52 |
| RICHMOND PLAZA | 52 |
| FOUR MILE RD | 48 |
| Other | 2,116 |
2002 - 2018 National Fire Incident Reporting System (NFIRS) incidents
- Incident types reported to NFIRS in Richmond, KY
- 4,98230.1%Fire
- 3,12218.9%Hazardous Condition
- 2,87017.4%Rescue & EMS
- 2,18413.2%Good Intent Call
- 1,85411.2%False Alarm
- 1,3067.9%Service Call
- 870.5%Special Incident
- 780.5%Overpressure Rupture
- 430.3%Severe Weather
- Fire incident types reported to NFIRS in Richmond, KY
- 1,84737.1%Structure Fires
- 1,82236.6%Outside Fires
- 1,02320.5%Mobile Property/Vehicle Fires
- 2905.8%Other
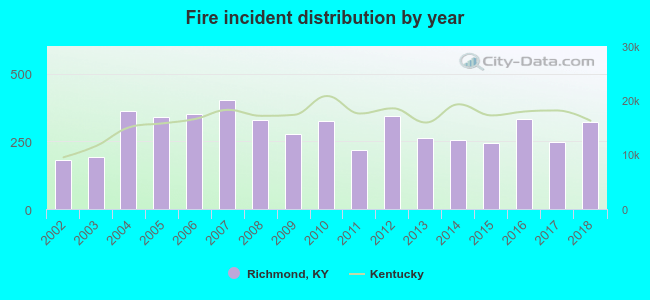 According to the data from the years 2002 - 2018 the average number of fires per year is 293. The highest number of reported fires - 401 took place in 2007, and the least - 179 in 2002. The data has a growing trend.
The average number of yearly fire incidents per 10k residents in Richmond, KY compared to nearest cities:
(Note: Based on data for the last 3 years, including only cities with population 5,000 and above)
| Richmond: | 89.8 |
| Berea: | 36.2 |
| Nicholasville: | 62.1 |
| Winchester: | 95.6 |
| Wilmore: | 12.5 |
| Danville: | 54.6 |
| Mount Sterling: | 1.4 |
| Harrodsburg: | 106.4 |
| Paris: | 76.3 |
 The median response time based on all reported fire incidents is 7 minutes. This is close to the Kentucky median value.
The median response time in Richmond, KY compared to nearest cities:
(Note: Based on data for all years, including only cities with at least 500 fire incidents)
| Richmond: | 7 minutes |
| Berea: | 9 minutes |
| Lancaster: | 10 minutes |
| Nicholasville: | 6 minutes |
| Irvine: | 13 minutes |
| Winchester: | 5 minutes |
| Brodhead: | 9 minutes |
| Stanford: | 11 minutes |
| Danville: | 5 minutes |
 According to the reports from the years 2002 - 2018 the average number of fire-related fatalities per year is 0. The highest number of reported deaths - 1 took place in 2007, and the lowest - 0 in 2002. The data has a constant trend.
The average number of deaths per 1,000 fires is 1. This indicator was the highest - 4 in 2015, and the lowest 0 in 2002. The trend for fatalities per 1,000 fire incidents is constant. Compared to the state value the number of deaths per 1,000 fires is much lower.
According to the reports from the years 2002 - 2018 the average number of fire-related fatalities per year is 0. The highest number of reported deaths - 1 took place in 2007, and the lowest - 0 in 2002. The data has a constant trend.
The average number of deaths per 1,000 fires is 1. This indicator was the highest - 4 in 2015, and the lowest 0 in 2002. The trend for fatalities per 1,000 fire incidents is constant. Compared to the state value the number of deaths per 1,000 fires is much lower.Deaths per 1,000 incidents in Richmond, KY compared to nearest cities:
(Note: Based on data for all years, including only cities with at least 2,500 fire incidents)
| Richmond: | 0.8 |
| London: | 1.9 |
 According to the data from the years 2002 - 2018 the average number of fire-related casualties per year is 3. The highest number of reported casualties - 10 took place in 2004, and the lowest - 0 in 2002. The data has a growing trend.
The average number of casualties per 1,000 fire incidents is 10. This indicator was the highest - 28 in 2004, and the lowest 0 in 2002. The trend for injuries per 1,000 fire incidents is growing. Compared to the Kentucky value the number of casualties per 1,000 fire incidents is higher.
According to the data from the years 2002 - 2018 the average number of fire-related casualties per year is 3. The highest number of reported casualties - 10 took place in 2004, and the lowest - 0 in 2002. The data has a growing trend.
The average number of casualties per 1,000 fire incidents is 10. This indicator was the highest - 28 in 2004, and the lowest 0 in 2002. The trend for injuries per 1,000 fire incidents is growing. Compared to the Kentucky value the number of casualties per 1,000 fire incidents is higher.Casualties per 1,000 incidents in Richmond, KY compared to nearest cities:
(Note: Based on data for all years, including only cities with at least 500 fire incidents)
| Richmond: | 10.4 |
| Berea: | 7.3 |
| Lancaster: | 1.2 |
| Nicholasville: | 15.5 |
| Irvine: | 8.1 |
| Winchester: | 5.9 |
| Brodhead: | 0.0 |
| Stanford: | 2.6 |
| Danville: | 7.2 |
 32.1% incidents where reported in the morning and 67.9% in the evening. The most fires (15.8%) took place on Saturday, and the least (13.2%) on Friday.
 Based on the 4,982 reports from years 2002 - 2018 most fires (10.4%) took place during April, and the least (6.6%) in May.
 Out of all 16,526 cases reported during the years 2002 - 2018, the most belonged to the categories: Fire (30.1%), Hazardous Condition (18.9%), and Rescue & EMS (17.4%).
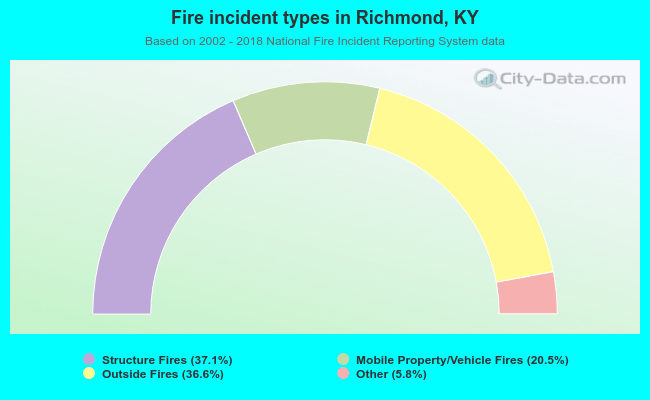 When looking into fire subcategories, the most incidents belonged to: Structure Fires (37.1%), and Outside Fires (36.6%).