Ridgefield: Fire Incidents, New Jersey (NJ)
Where are fire incidents reported in Ridgefield, NJ
Something went wrong! Please refresh the page.
|
| |||||||||||||||||||||||||||||||||||||||||||||||||||||||||||||||||||||||||||||||||||||||||||||||||||||||||||||
2002 - 2018 National Fire Incident Reporting System (NFIRS) incidents
- Incident types reported to NFIRS in Ridgefield, NJ
- 1,14241.0%Hazardous Condition
- 67324.2%False Alarm
- 65723.6%Fire
- 1063.8%Service Call
- 1063.8%Good Intent Call
- 853.1%Rescue & EMS
- 60.2%Special Incident
- 40.1%Overpressure Rupture
- 30.1%Severe Weather
- Fire incident types reported to NFIRS in Ridgefield, NJ
- 30646.6%Structure Fires
- 14922.7%Outside Fires
- 14722.4%Mobile Property/Vehicle Fires
- 558.4%Other
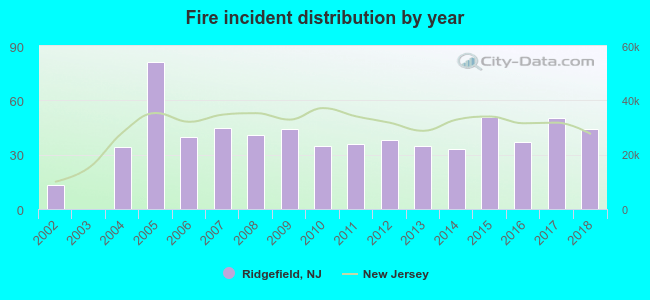 Based on the data from the years 2002 - 2018 the average number of fires per year is 39. The highest number of fire incidents - 81 took place in 2005, and the least - 0 in 2003. The data has an increasing trend.
The average number of yearly fire incidents per 10k residents in Ridgefield, NJ compared to nearest cities:
(Note: Based on data for the last 3 years, including only cities with population 5,000 and above)
| Ridgefield: | 38.7 |
| Palisades Park: | 37.8 |
| Cliffside Park: | 53.6 |
| Fairview: | 16.3 |
| Edgewater: | 39.4 |
| Fort Lee: | 43.8 |
| Ridgefield Park: | 30.3 |
| Little Ferry: | 19.0 |
| Leonia: | 53.6 |
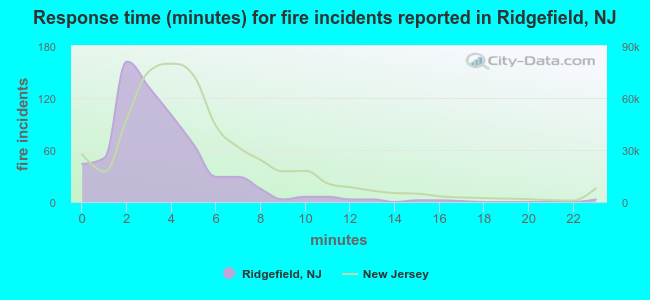 The median response time based on all reported fire incidents is 3 minutes. This is lower compared to the state median value.
The median response time in Ridgefield, NJ compared to nearest cities:
(Note: Based on data for all years, including only cities with at least 500 fire incidents)
| Ridgefield: | 3 minutes |
| Palisades Park: | 2 minutes |
| Cliffside Park: | 5 minutes |
| Edgewater: | 3 minutes |
| Fort Lee: | 4 minutes |
| Leonia: | 3 minutes |
| West New York: | 4 minutes |
| Teaneck: | 3 minutes |
| Secaucus: | 4 minutes |
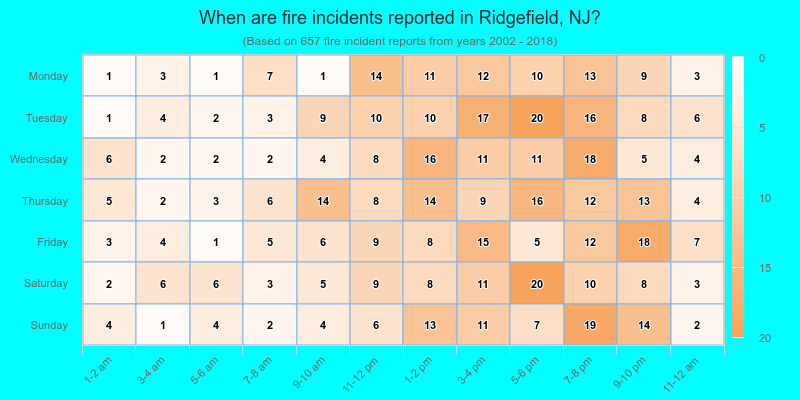
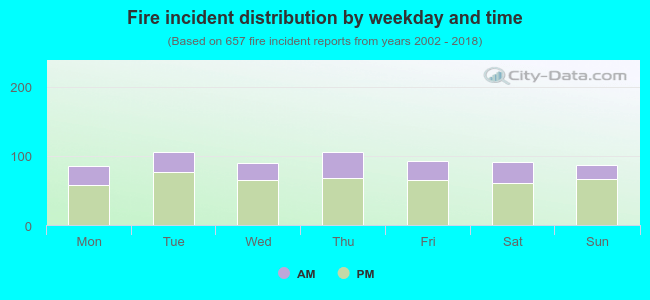 30.1% incidents where reported in the morning and 69.9% in the evening. The most fires (16.1%) took place on Tuesday, and the least (12.9%) on Monday.
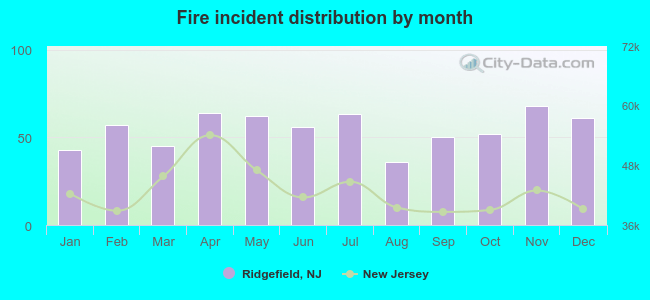 Based on the 657 fires from years 2002 - 2018 most fires (10.4%) took place during November, and the least (5.5%) in August.
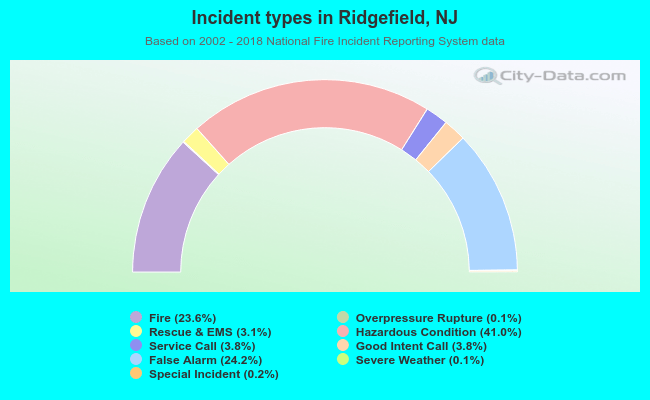 Out of all 2,782 cases reported during the years 2002 - 2018, the most belonged to the categories: Hazardous Condition (41.0%), False Alarm (24.2%), and Fire (23.6%).
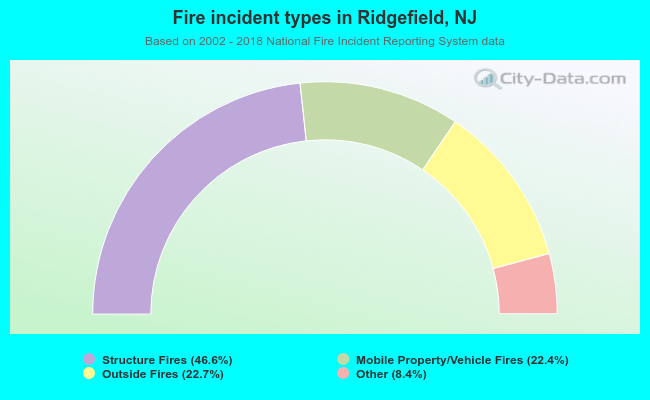 When looking into fire subcategories, the most incidents belonged to: Structure Fires (46.6%), and Outside Fires (22.7%).