River Ridge: Fire Incidents, Louisiana (LA)
Where are fire incidents reported in River Ridge, LA
Something went wrong! Please refresh the page.
|
| |||||||||||||||||||||||||||||||||||||||||||||||||||||||||||||||||||||||||||||||||||||||||||||||||||||||||||||
2002 - 2018 National Fire Incident Reporting System (NFIRS) incidents
- Incident types reported to NFIRS in River Ridge, LA
- 50521.6%False Alarm
- 49521.2%Hazardous Condition
- 47220.2%Rescue & EMS
- 45019.3%Fire
- 27611.8%Good Intent Call
- 1275.4%Service Call
- 40.2%Severe Weather
- Fire incident types reported to NFIRS in River Ridge, LA
- 20244.9%Structure Fires
- 16336.2%Outside Fires
- 6614.7%Mobile Property/Vehicle Fires
- 194.2%Other
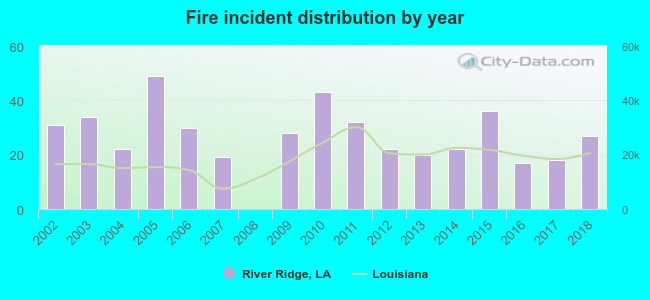 Based on the data from the years 2002 - 2018 the average number of fires per year is 26. The highest number of fires - 49 took place in 2005, and the least - 0 in 2008. The data has a dropping trend.
The average number of yearly fire incidents per 10k residents in River Ridge, LA compared to nearest cities:
(Note: Based on data for the last 3 years, including only cities with population 5,000 and above)
| River Ridge: | 15.3 |
| Harahan: | 3.9 |
| Waggaman: | 26.3 |
| Metairie: | 15.6 |
| Jefferson: | 47.1 |
| Kenner: | 25.8 |
| Bridge City: | 23.4 |
| Westwego: | 38.6 |
| Marrero: | 60.6 |
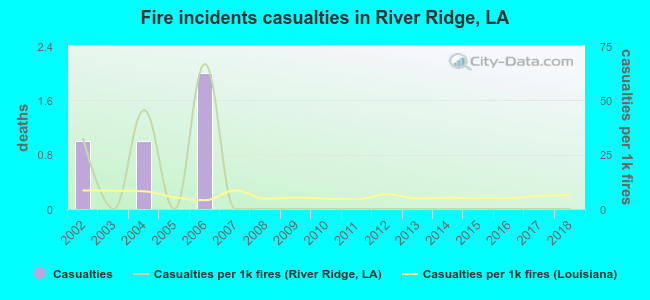 Based on the reports from the years 2002 - 2018 the average number of fire-related casualties per year is 0. The highest number of injuries - 2 took place in 2006, and the lowest - 0 in 2003. The data has a declining trend.
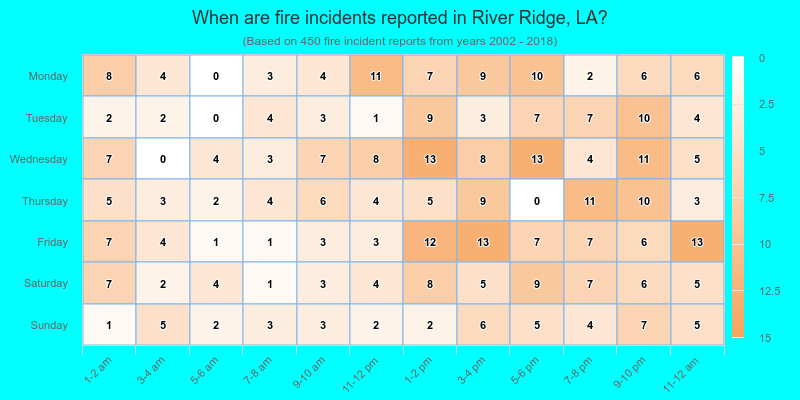
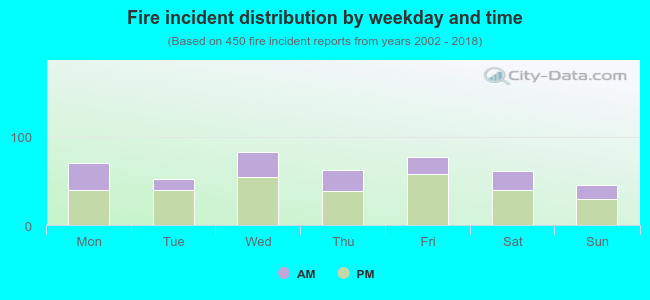 33.6% incidents where reported in the morning and 66.4% in the evening. The most fires (18.4%) took place on Wednesday, and the least (10.0%) on Sunday.
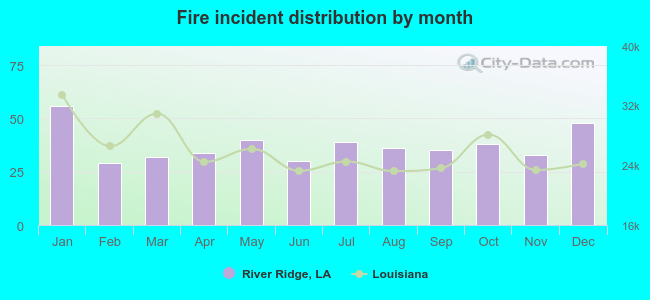 According to the 450 fire incident reports from years 2002 - 2018 most fires (12.4%) took place during January, and the least (6.4%) in February.
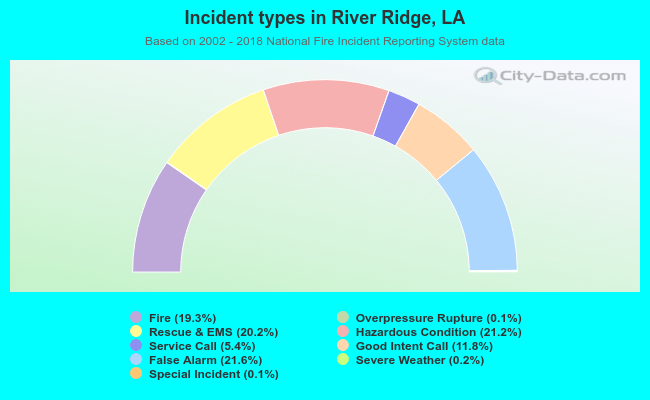 Out of all 2,333 cases reported during the years 2002 - 2018, the most belonged to the categories: False Alarm (21.6%), Hazardous Condition (21.2%), and Rescue & EMS (20.2%).
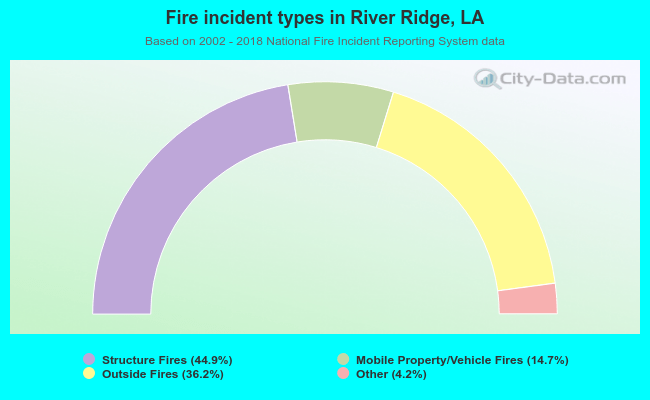 When looking into fire subcategories, the most reports belonged to: Structure Fires (44.9%), and Outside Fires (36.2%).