Rock Island: Fire Incidents, Illinois (IL)
Where are fire incidents reported in Rock Island, IL
Something went wrong! Please refresh the page.
| Fire incidents reported | |
|---|---|
| Sreet name | Count |
| 11 ST | 32 |
| 11TH ST | 30 |
| 18 AVE | 30 |
| 9TH ST | 30 |
| 12 ST | 24 |
| 24 ST | 24 |
| 5TH ST | 24 |
| 9 ST | 24 |
| GLENHURST CT | 20 |
| 13 AVE | 18 |
| 15TH ST | 18 |
| 20 ST | 18 |
| 38 ST | 18 |
| 5 ST | 18 |
| 7TH ST | 18 |
| 12TH ST | 16 |
| 14TH ST | 16 |
| 17 AVE | 16 |
| 30 ST | 16 |
| 30TH ST | 16 |
| 6 AVE | 16 |
| 7 AVE | 16 |
| 78 AVE | 16 |
| 14 ST | 14 |
| 17TH ST | 14 |
| 38TH ST | 14 |
| 4TH ST | 14 |
| 17 ST | 12 |
| 19TH ST | 12 |
| 20TH ST | 12 |
| Other | 180 |
2003 - 2018 National Fire Incident Reporting System (NFIRS) incidents
- Incident types reported to NFIRS in Rock Island, IL
- 12,27872.0%Rescue & EMS
- 1,6579.7%Service Call
- 1,0015.9%Good Intent Call
- 8965.3%False Alarm
- 7464.4%Fire
- 3732.2%Hazardous Condition
- 740.4%Overpressure Rupture
- 260.2%Special Incident
- Fire incident types reported to NFIRS in Rock Island, IL
- 32443.4%Structure Fires
- 21729.1%Outside Fires
- 13017.4%Mobile Property/Vehicle Fires
- 7510.1%Other
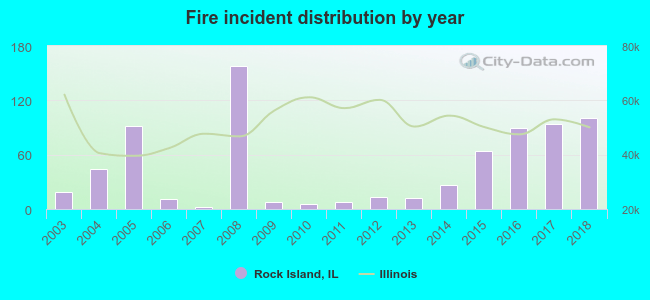 According to the data from the years 2003 - 2018 the average number of fire incidents per year is 47. The highest number of fires - 158 took place in 2008, and the least - 2 in 2007. The data has an increasing trend.
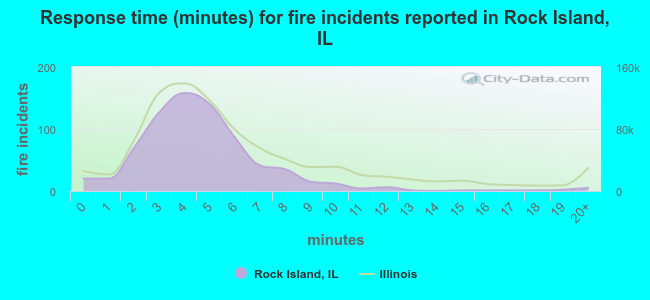 The median response time based on all reported fire incidents is 4 minutes. This is lower compared to the state median value.
The median response time in Rock Island, IL compared to nearest cities:
(Note: Based on data for all years, including only cities with at least 500 fire incidents)
| Rock Island: | 4 minutes |
| Milan: | 8 minutes |
| Moline: | 5 minutes |
| East Moline: | 5 minutes |
| Colona: | 6 minutes |
| Geneseo: | 8 minutes |
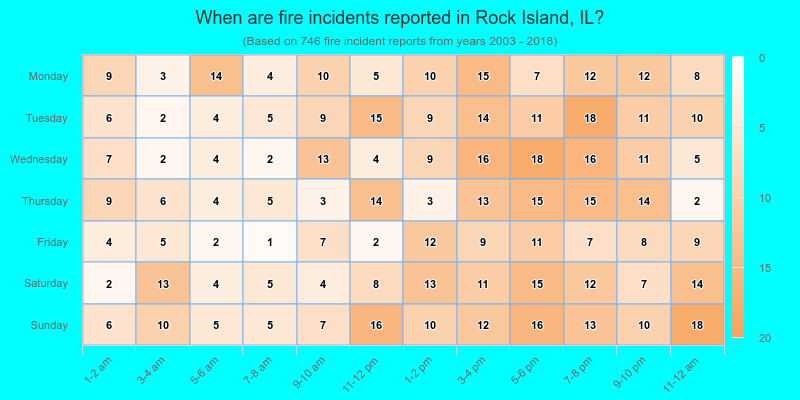
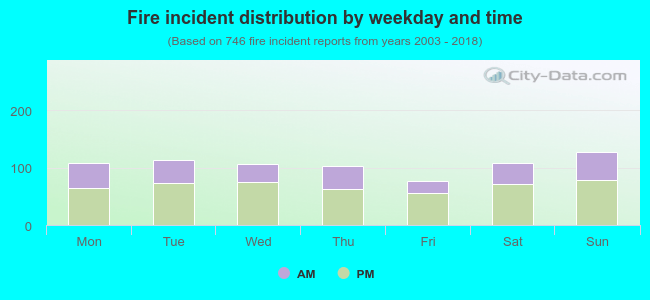 35.5% incidents where reported in the morning and 64.5% in the evening. The most fires (17.2%) took place on Sunday, and the least (10.3%) on Friday.
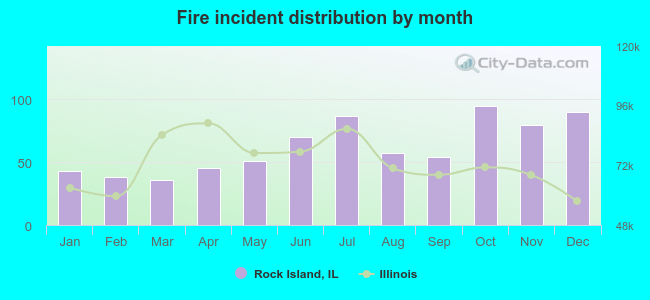 Based on the 746 reports from years 2003 - 2018 most fires (12.7%) took place during October, and the least (4.8%) in March.
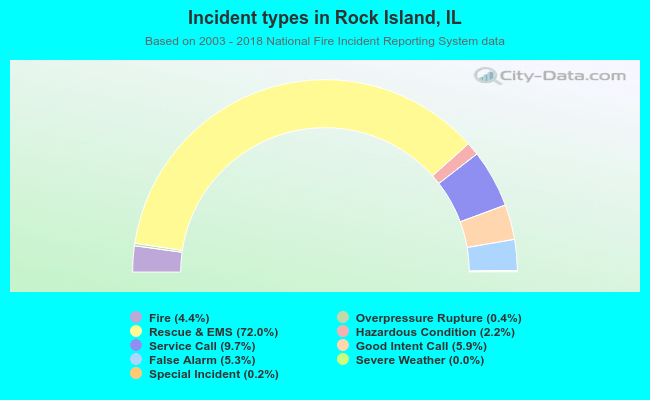 Out of all 17,054 cases reported during the years 2003 - 2018, the most belonged to the categories: Rescue & EMS (72.0%), Service Call (9.7%), and Good Intent Call (5.9%).
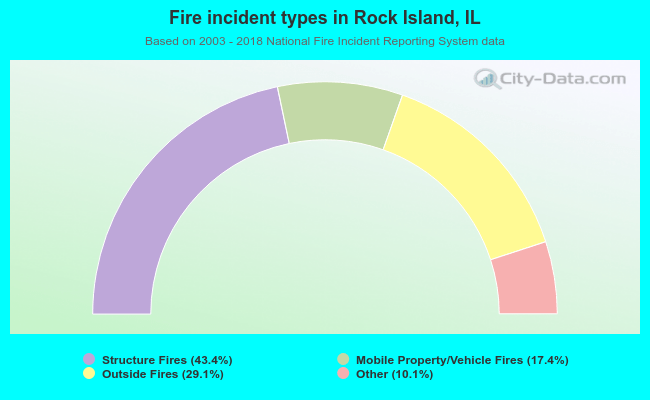 When looking into fire subcategories, the most reports belonged to: Structure Fires (43.4%), and Outside Fires (29.1%).