Rolesville: Fire Incidents, North Carolina (NC)
Where are fire incidents reported in Rolesville, NC
Something went wrong! Please refresh the page.
|
| |||||||||||||||||||||||||||||||||||||||||||||||||||||||||||||||||||||||||||||||||||||||||||||||||||||||||||||
2002 - 2018 National Fire Incident Reporting System (NFIRS) incidents
- Incident types reported to NFIRS in Rolesville, NC
- 1,65658.3%Rescue & EMS
- 32211.3%Good Intent Call
- 2488.7%Fire
- 2227.8%False Alarm
- 2117.4%Hazardous Condition
- 1806.3%Service Call
- Fire incident types reported to NFIRS in Rolesville, NC
- 12751.2%Structure Fires
- 9237.1%Outside Fires
- 2510.1%Mobile Property/Vehicle Fires
- 41.6%Other
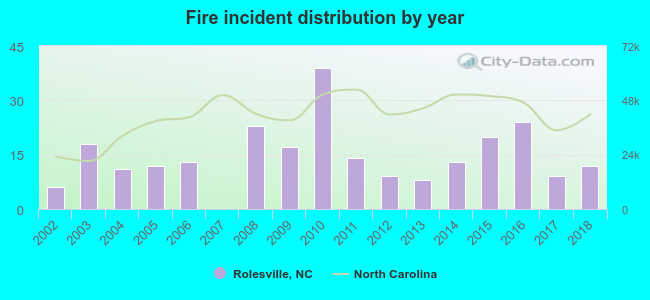 Based on the data from the years 2002 - 2018 the average number of fires per year is 15. The highest number of reported fire incidents - 39 took place in 2010, and the least - 0 in 2007. The data has a rising trend.
The average number of yearly fire incidents per 10k residents in Rolesville, NC compared to nearest cities:
(Note: Based on data for the last 3 years, including only cities with population 5,000 and above)
| Rolesville: | 25.9 |
| Wake Forest: | 42.9 |
| Knightdale: | 119.9 |
| Wendell: | 196.8 |
| Raleigh: | 24.8 |
| Garner: | 53.3 |
| Clayton: | 129.0 |
| Cary: | 16.8 |
| Morrisville: | 25.0 |

 29.4% incidents where reported in the morning and 70.6% in the evening. The most fires (17.7%) took place on Friday, and the least (11.3%) on Saturday.
 According to the 248 fires from years 2002 - 2018 most fires (12.5%) took place during March, and the least (3.2%) in November.
 Out of all 2,840 cases reported during the years 2002 - 2018, the most belonged to the categories: Overpressure Rupture (58.3%), Service Call (11.3%), and Fire (8.7%).
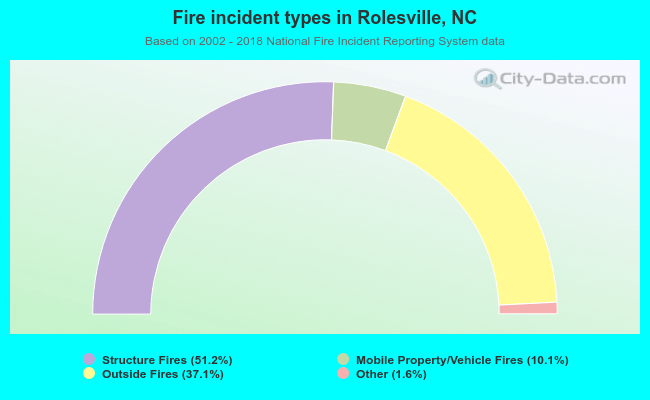 When looking into fire subcategories, the most incidents belonged to: Structure Fires (51.2%), and Outside Fires (37.1%).