Roosevelt: Fire Incidents, New York (NY)
Where are fire incidents reported in Roosevelt, NY
Something went wrong! Please refresh the page.
|
| |||||||||||||||||||||||||||||||||||||||||||||||||||||||||||||||||||||||||||||||||||||||||||||||||||||||||||||
2002 - 2018 National Fire Incident Reporting System (NFIRS) incidents
- Incident types reported to NFIRS in Roosevelt, NY
- 55229.6%False Alarm
- 47225.3%Rescue & EMS
- 42923.0%Fire
- 22311.9%Hazardous Condition
- 1045.6%Service Call
- 723.9%Good Intent Call
- 150.8%Special Incident
- Fire incident types reported to NFIRS in Roosevelt, NY
- 33778.6%Structure Fires
- 4410.3%Outside Fires
- 276.3%Other
- 214.9%Mobile Property/Vehicle Fires
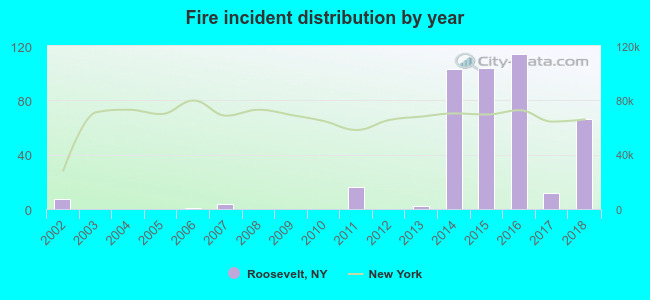 Based on the data from the years 2002 - 2018 the average number of fires per year is 25. The highest number of reported fires - 114 took place in 2016, and the least - 0 in 2003. The data has an increasing trend.
The average number of yearly fire incidents per 10k residents in Roosevelt, NY compared to nearest cities:
(Note: Based on data for the last 3 years, including only cities with population 5,000 and above)
| Roosevelt: | 39.4 |
| North Merrick: | 6.9 |
| Uniondale: | 5.1 |
| Baldwin: | 29.4 |
| Freeport: | 20.8 |
| Merrick: | 13.0 |
| Hempstead: | 31.0 |
| North Bellmore: | 5.8 |
| East Meadow: | 3.1 |

 31.7% incidents where reported in the morning and 68.3% in the evening. The most fires (17.2%) took place on Wednesday, and the least (11.4%) on Friday.
 Based on the 429 reports from years 2002 - 2018 most fires (12.6%) took place during December, and the least (5.4%) in September.
 Out of all 1,867 cases reported during the years 2002 - 2018, the most belonged to the categories: Good Intent Call (29.6%), Overpressure Rupture (25.3%), and Fire (23.0%).
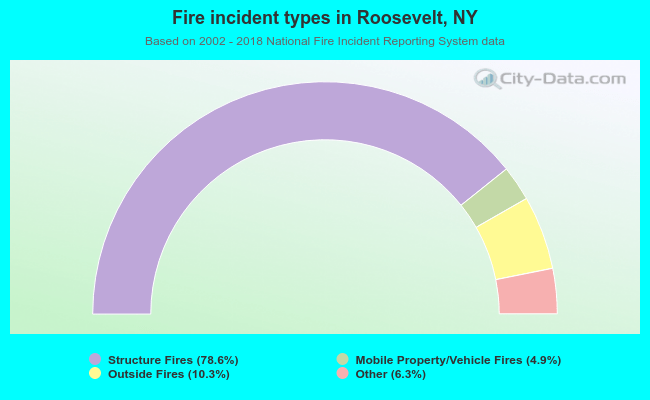 When looking into fire subcategories, the most reports belonged to: Structure Fires (78.6%), and Outside Fires (10.3%).