Roseville: Fire Incidents, Michigan (MI)
Where are fire incidents reported in Roseville, MI
Something went wrong! Please refresh the page.
| Fire incidents reported | |
|---|---|
| Sreet name | Count |
| GRATIOT HWY | 386 |
| GRATIOT | 296 |
| GROESBECK HWY | 110 |
| 12 MILE RD | 102 |
| LITTLE MACK | 102 |
| UTICA | 86 |
| 13 MILE RD | 82 |
| GROESBECK | 72 |
| THIRTEEN MILE | 72 |
| COMMON RD | 52 |
| FRAZHO | 52 |
| GRATIOT AVE | 52 |
| LITTLE MACK AVE | 50 |
| COMMON | 46 |
| 11 MILE RD | 44 |
| FRAZHO RD | 40 |
| I94 EXPY | 38 |
| EASTLAND | 36 |
| KELLY | 36 |
| MARQUETTE | 36 |
| MARTIN | 34 |
| QUINKERT | 34 |
| EASTLAND ST | 32 |
| JEROME ST | 32 |
| MARTIN RD | 32 |
| TWELVE MILE | 32 |
| MAPLE | 30 |
| BELANGER | 28 |
| MASONIC | 28 |
| PINEHURST | 28 |
| Other | 475 |
2002 - 2018 National Fire Incident Reporting System (NFIRS) incidents
- Incident types reported to NFIRS in Roseville, MI
- 27,32374.3%Rescue & EMS
- 2,7167.4%Hazardous Condition
- 2,5757.0%Fire
- 1,5094.1%Good Intent Call
- 1,3883.8%Service Call
- 1,1853.2%False Alarm
- 500.1%Special Incident
- Fire incident types reported to NFIRS in Roseville, MI
- 1,19946.6%Structure Fires
- 67326.1%Outside Fires
- 57922.5%Mobile Property/Vehicle Fires
- 1244.8%Other
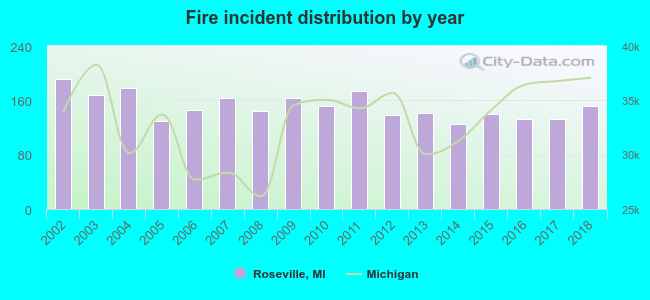 According to the data from the years 2002 - 2018 the average number of fires per year is 151. The highest number of reported fires - 192 took place in 2002, and the least - 125 in 2014. The data has a decreasing trend.
The average number of yearly fire incidents per 10k residents in Roseville, MI compared to nearest cities:
(Note: Based on data for the last 3 years, including only cities with population 5,000 and above)
| Roseville: | 29.2 |
| Fraser: | 15.7 |
| Eastpointe: | 32.2 |
| Warren: | 21.1 |
| Harper Woods: | 17.7 |
| Center Line: | 78.6 |
| Grosse Pointe Woods: | 17.1 |
| Sterling Heights: | 18.3 |
| Grosse Pointe Farms: | 14.0 |
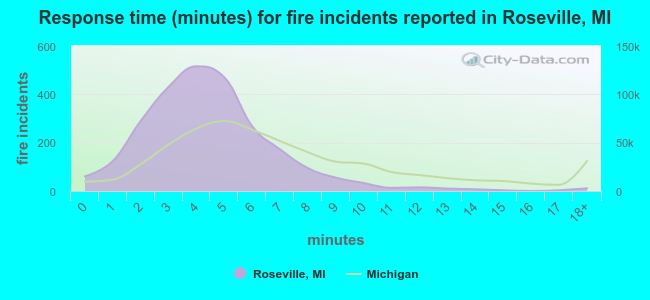 The median response time based on all reported fire incidents is 4 minutes. This is lower than the Michigan median value.
The median response time in Roseville, MI compared to nearest cities:
(Note: Based on data for all years, including only cities with at least 500 fire incidents)
| Roseville: | 4 minutes |
| St. Clair Shores: | 4 minutes |
| Eastpointe: | 4 minutes |
| Warren: | 5 minutes |
| Harper Woods: | 3 minutes |
| Center Line: | 3 minutes |
| Sterling Heights: | 5 minutes |
| Mount Clemens: | 3 minutes |
| Madison Heights: | 3 minutes |
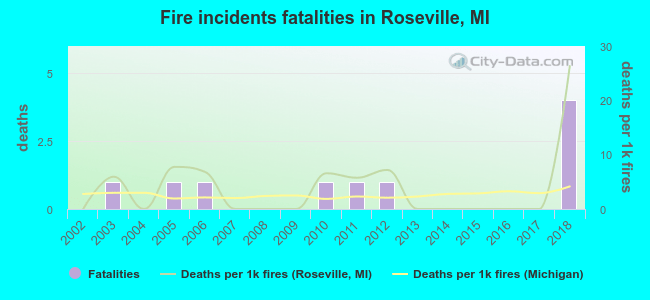 Based on the reports from the years 2002 - 2018 the average number of fire-related yearly deaths is 1. The highest number of deaths - 4 took place in 2018, and the lowest - 0 in 2002. The data has a rising trend.
The average number of fatalities per 1,000 fires is 4. This indicator was the highest - 26 in 2018, and the lowest 0 in 2002. The trend for fatalities per 1,000 fire incidents is growing. Compared to the state value the number of deaths per 1,000 incidents is higher.
Based on the reports from the years 2002 - 2018 the average number of fire-related yearly deaths is 1. The highest number of deaths - 4 took place in 2018, and the lowest - 0 in 2002. The data has a rising trend.
The average number of fatalities per 1,000 fires is 4. This indicator was the highest - 26 in 2018, and the lowest 0 in 2002. The trend for fatalities per 1,000 fire incidents is growing. Compared to the state value the number of deaths per 1,000 incidents is higher.Deaths per 1,000 incidents in Roseville, MI compared to nearest cities:
(Note: Based on data for all years, including only cities with at least 2,500 fire incidents)
| Roseville: | 3.9 |
| Warren: | 2.2 |
| Sterling Heights: | 2.4 |
| Detroit: | 2.2 |
| Troy: | 1.8 |
| Southfield: | 3.1 |
| Dearborn: | 1.8 |
| Pontiac: | 3.8 |
| Taylor: | 3.2 |
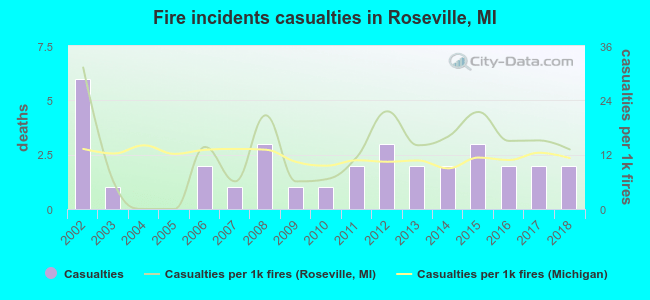 According to the data from the years 2002 - 2018 the average number of fire-related yearly casualties is 2. The highest number of reported injuries - 6 took place in 2002, and the lowest - 0 in 2004. The data has a dropping trend.
The average number of casualties per 1,000 fire incidents is 13. This indicator was the highest - 31 in 2002, and the lowest 0 in 2004. The trend for casualties per 1,000 fire incidents is decreasing. Compared to the Michigan value the number of casualties per 1,000 fires is about the same.
According to the data from the years 2002 - 2018 the average number of fire-related yearly casualties is 2. The highest number of reported injuries - 6 took place in 2002, and the lowest - 0 in 2004. The data has a dropping trend.
The average number of casualties per 1,000 fire incidents is 13. This indicator was the highest - 31 in 2002, and the lowest 0 in 2004. The trend for casualties per 1,000 fire incidents is decreasing. Compared to the Michigan value the number of casualties per 1,000 fires is about the same.Casualties per 1,000 incidents in Roseville, MI compared to nearest cities:
(Note: Based on data for all years, including only cities with at least 500 fire incidents)
| Roseville: | 12.8 |
| St. Clair Shores: | 16.8 |
| Eastpointe: | 29.7 |
| Warren: | 24.1 |
| Harper Woods: | 10.9 |
| Center Line: | 31.9 |
| Sterling Heights: | 49.4 |
| Mount Clemens: | 8.5 |
| Madison Heights: | 10.5 |
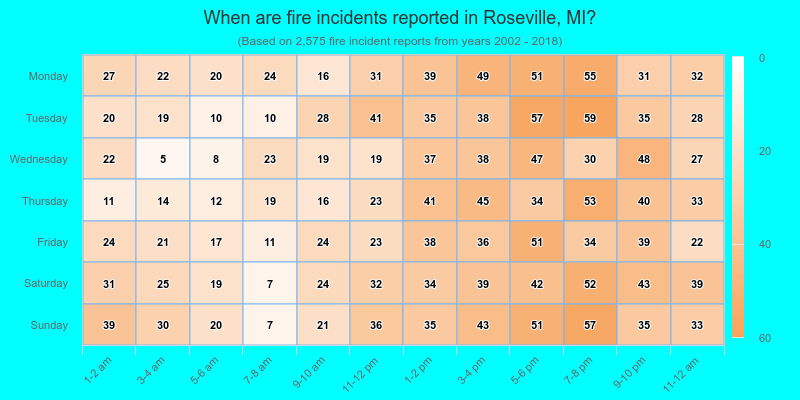
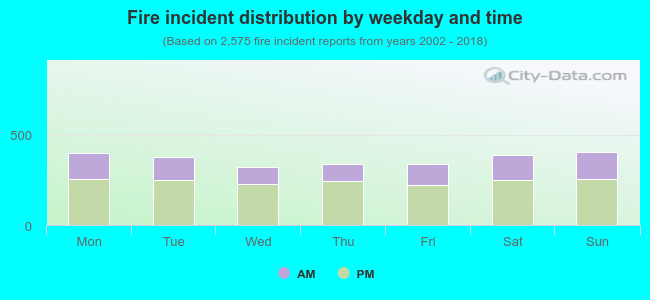 33.8% incidents where reported in the morning and 66.2% in the evening. The most fires (15.8%) took place on Sunday, and the least (12.5%) on Wednesday.
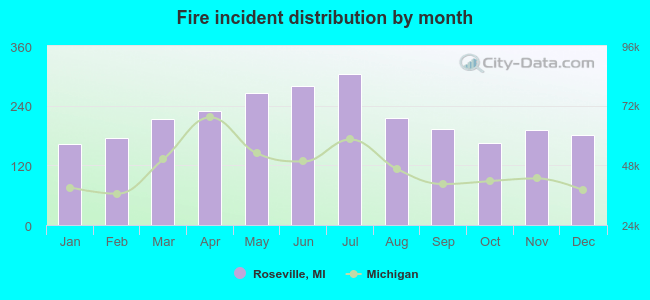 Based on the 2,575 fire incidents from years 2002 - 2018 most fires (11.8%) took place during July, and the least (6.3%) in January.
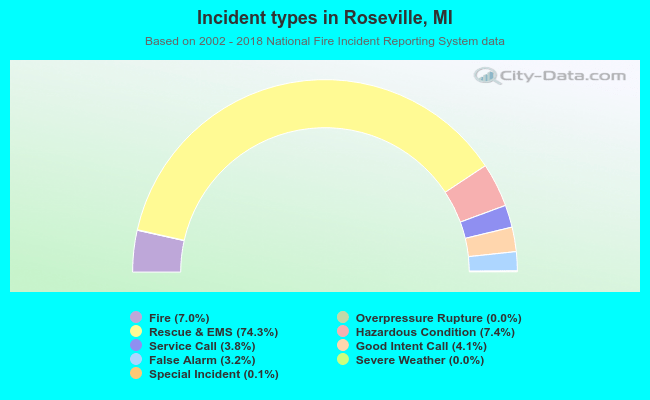 Out of all 36,765 cases reported during the years 2002 - 2018, the most belonged to the categories: Rescue & EMS (74.3%), Hazardous Condition (7.4%), and Fire (7.0%).
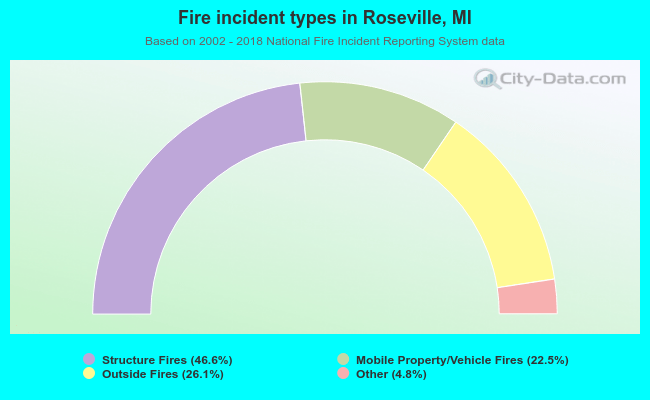 When looking into fire subcategories, the most incidents belonged to: Structure Fires (46.6%), and Outside Fires (26.1%).