| Fire incidents reported |
|---|
| Sreet name | Count |
|---|
| WINSTON RD | 12 | | WILKE RD | 10 | | X-WAY | 8 | | WATER RD | 6 | | WILKE | 6 | | 120TH | 4 | | 142ND ST | 4 | | 144TH AVE | 4 | | 88TH AVE | 4 | | ARTHUR RD | 4 | | FOREST GLEN RD | 4 | | MCKINLEY RD | 4 | | OCEANA DR | 4 | | PARK RD | 4 | | SAND CREEK RD | 4 | | 076 WEST MCKINLEY RD. | 2 | | 0CEANA DR | 2 | | 108TH AVE | 2 | | 108TH AVEWEST MCKINLEY RD | 2 | | 1118 SKEELS RD | 2 | | 116TH & MC KINLEY RD. | 2 | | 116TH AVE | 2 | | 116TH ST | 2 | | 116TH, AVE. | 2 | | 118 WEST WILKE RD. | 2 |
| | | Fire incidents reported |
|---|
| Sreet name | Count |
|---|
| 120TH AVE | 2 | | 120TH ST | 2 | | 128TH AVE | 2 | | 138 WEST MCKINLEY RD. | 2 | | 1452 WEST WINSTON RD. | 2 | | 1540 WEST WINSTON RD. | 2 | | 1713 EAST WILKE RD. | 2 | | 1718 WINSTON RD. | 2 | | 2335 WEST WINSTON RD. | 2 | | 2444 WHITETAIL DR. | 2 | | 2464 SCENIC VIEW DRIVE | 2 | | 2475 WEST MEADOW LANE DR | 2 | | 2488 ALDER COURT AVE. | 2 | | 2488 ALDER CT. | 2 | | 2524 MEADOW LANE DR | 2 | | 2563 SOUTH WESTSHORE DRIVE | 2 | | 2585 WEST TIMBERLINE DR. | 2 | | 2618 CLEVELAND RD. | 2 | | 2622 WEST WINSTON RD | 2 | | 2625 WEST WINSTON RD | 2 | | 2729 WINSTON RD. | 2 | | 289 CLEVLAND RD | 2 | | 296 EAST WILKE RD. | 2 | | 2993 WEST CLAY RD | 2 | | |
|
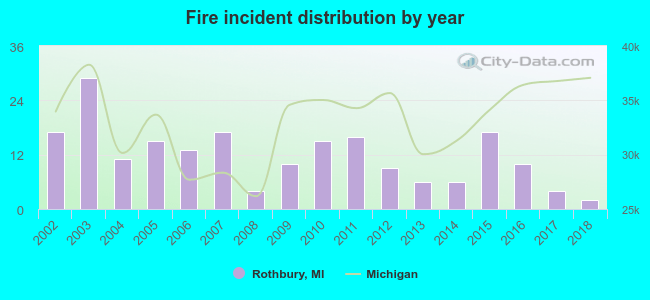 Based on the data from the years 2002 - 2018 the average number of fires per year is 12. The highest number of fire incidents - 29 took place in 2003, and the least - 2 in 2018. The data has a declining trend.
 29.9% incidents where reported in the morning and 70.1% in the evening. The most fires (17.9%) took place on Saturday, and the least (10.4%) on Thursday.
 According to the 201 incident reports from years 2002 - 2018 most fires (11.4%) took place during April, and the least (4.5%) in January.
 Out of all 434 cases reported during the years 2002 - 2018, the most belonged to the categories: Fire (46.3%), Service Call (18.4%), and Rescue & EMS (17.5%).
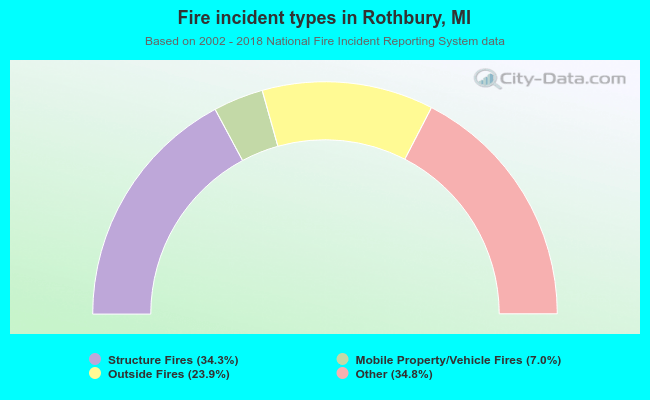 When looking into fire subcategories, the most reports belonged to: Other (34.8%), and Structure Fires (34.3%).