Round Lake Beach: Fire Incidents, Illinois (IL)
Where are fire incidents reported in Round Lake Beach, IL
Something went wrong! Please refresh the page.
| Fire incidents reported | |
|---|---|
| Sreet name | Count |
| ROLLINS RD | 236 |
| CEDAR LAKE RD | 118 |
| GOLFVIEW DR | 108 |
| ROUTE 83 | 44 |
| CENTRAL PARK DR | 42 |
| CLARENDON DR | 36 |
| FAIRFIELD RD | 36 |
| PLEASANT DR | 36 |
| HAWTHORNE DR | 34 |
| IDLEWILD DR | 32 |
| MEADOW GREEN LN | 30 |
| LOTUS DR | 28 |
| NORTH CHANNEL DR | 26 |
| CHEROKEE DR | 24 |
| WOODRIDGE DR | 24 |
| JUNEWAY TER | 22 |
| MEADOWBROOK DR | 22 |
| OAKWOOD DR | 22 |
| BEVERLY DR | 20 |
| BRENTWOOD DR | 20 |
| ELM AVE | 20 |
| MORNINGSIDE DR | 20 |
| PINE GROVE AVE | 20 |
| WOODLAND DR | 20 |
| FERNDALE DR | 18 |
| HICKORY AVE | 18 |
| SOUTH CHANNEL DR | 18 |
| BARBERRY LN | 16 |
| BEACHVIEW DR | 16 |
| EAST END AVE | 16 |
| Other | 4 |
2002 - 2018 National Fire Incident Reporting System (NFIRS) incidents
- Incident types reported to NFIRS in Round Lake Beach, IL
- 10,91666.9%Rescue & EMS
- 2,06412.7%Hazardous Condition
- 1,1467.0%Fire
- 1,0616.5%False Alarm
- 6754.1%Service Call
- 4032.5%Good Intent Call
- 250.2%Severe Weather
- Fire incident types reported to NFIRS in Round Lake Beach, IL
- 60452.7%Structure Fires
- 39834.7%Outside Fires
- 13511.8%Mobile Property/Vehicle Fires
- 90.8%Other
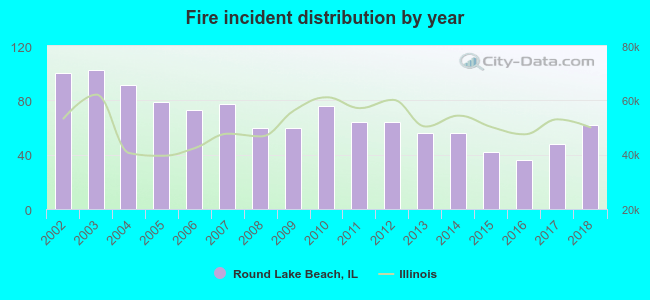 Based on the data from the years 2002 - 2018 the average number of fires per year is 67. The highest number of fires - 102 took place in 2003, and the least - 36 in 2016. The data has a dropping trend.
The average number of yearly fire incidents per 10k residents in Round Lake Beach, IL compared to nearest cities:
(Note: Based on data for the last 3 years, including only cities with population 5,000 and above)
| Round Lake Beach: | 17.4 |
| Round Lake: | 33.3 |
| Round Lake Park: | 11.3 |
| Lake Villa: | 38.1 |
| Grayslake: | 33.6 |
| Lindenhurst: | 8.1 |
| Fox Lake: | 42.2 |
| Gages Lake: | 1.3 |
| Lakemoor: | 28.3 |
 The median response time based on all reported fire incidents is 4 minutes. This is lower compared to the state median value.
The median response time in Round Lake Beach, IL compared to nearest cities:
(Note: Based on data for all years, including only cities with at least 500 fire incidents)
| Round Lake Beach: | 4 minutes |
| Round Lake: | 5 minutes |
| Lake Villa: | 7 minutes |
| Grayslake: | 6 minutes |
| Fox Lake: | 6 minutes |
| Antioch: | 8 minutes |
| Gurnee: | 6 minutes |
| Wauconda: | 6 minutes |
| Mundelein: | 5 minutes |
 According to the data from the years 2002 - 2018 the average number of fire-related yearly casualties is 1. The highest number of reported injuries - 6 took place in 2005, and the lowest - 0 in 2002. The data has a constant trend.
The average number of injuries per 1,000 fires is 21. This indicator was the highest - 83 in 2008, and the lowest 0 in 2002. The trend for injuries per 1,000 fire incidents is constant. Compared to the Illinois value the number of injuries per 1,000 fires is higher.
According to the data from the years 2002 - 2018 the average number of fire-related yearly casualties is 1. The highest number of reported injuries - 6 took place in 2005, and the lowest - 0 in 2002. The data has a constant trend.
The average number of injuries per 1,000 fires is 21. This indicator was the highest - 83 in 2008, and the lowest 0 in 2002. The trend for injuries per 1,000 fire incidents is constant. Compared to the Illinois value the number of injuries per 1,000 fires is higher.Casualties per 1,000 incidents in Round Lake Beach, IL compared to nearest cities:
(Note: Based on data for all years, including only cities with at least 500 fire incidents)
| Round Lake Beach: | 21.8 |
| Round Lake: | 14.2 |
| Lake Villa: | 9.6 |
| Grayslake: | 15.9 |
| Fox Lake: | 2.8 |
| Antioch: | 7.2 |
| Gurnee: | 25.4 |
| Wauconda: | 7.1 |
| Mundelein: | 10.6 |
 31.2% incidents where reported in the morning and 68.8% in the evening. The most fires (17.1%) took place on Saturday, and the least (12.0%) on Thursday.
 According to the 1,146 fire incidents from years 2002 - 2018 most fires (12.1%) took place during July, and the least (6.0%) in February.
 Out of all 16,309 cases reported during the years 2002 - 2018, the most belonged to the categories: Rescue & EMS (66.9%), Hazardous Condition (12.7%), and Fire (7.0%).
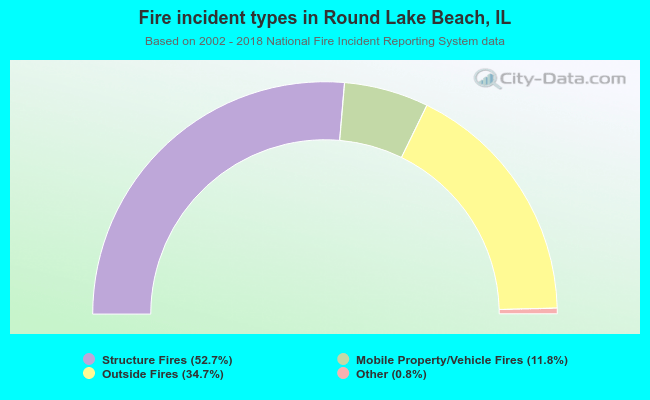 When looking into fire subcategories, the most incidents belonged to: Structure Fires (52.7%), and Outside Fires (34.7%).