Salt Lake City: Fire Incidents, Utah (UT)
Where are fire incidents reported in Salt Lake City, UT
Something went wrong! Please refresh the page.
| Fire incidents reported | |
|---|---|
| Sreet name | Count |
| REDWOOD RD | 458 |
| 200 SOUTH ST | 400 |
| 900 | 356 |
| MAIN ST | 348 |
| NORTH TEMPLE ST | 348 |
| SALT LAKE COUNTY | 312 |
| STATE ST | 302 |
| 200 | 294 |
| 300 | 262 |
| 900 WEST ST | 260 |
| 700 | 248 |
| WEST TEMPLE ST | 224 |
| 2100 SOUTH ST | 198 |
| 400 SOUTH ST | 198 |
| 500 | 194 |
| 400 | 192 |
| 300 EAST ST | 180 |
| 2100 | 176 |
| TERMINAL NORTHBOUND DR | 174 |
| SOUTH TEMPLE ST | 170 |
| 600 | 166 |
| 300 WEST ST | 154 |
| 500 SOUTH ST | 154 |
| 300 SOUTH ST | 150 |
| 800 | 148 |
| 1300 | 146 |
| 700 SOUTH ST | 146 |
| FOOTHILL DR | 140 |
| 900 SOUTH ST | 134 |
| 100 SOUTH ST | 116 |
| Other | 3,806 |
2002 - 2018 National Fire Incident Reporting System (NFIRS) incidents
- Incident types reported to NFIRS in Salt Lake City, UT
- 10,55421.9%Fire
- 10,22921.3%False Alarm
- 10,00520.8%Hazardous Condition
- 9,74620.3%Good Intent Call
- 3,8908.1%Service Call
- 3,2026.7%Rescue & EMS
- 2570.5%Special Incident
- 2090.4%Overpressure Rupture
- Fire incident types reported to NFIRS in Salt Lake City, UT
- 4,25140.3%Outside Fires
- 3,84036.4%Structure Fires
- 2,06419.6%Mobile Property/Vehicle Fires
- 3993.8%Other
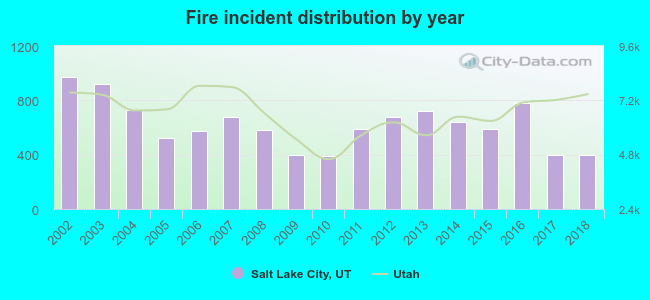 According to the data from the years 2002 - 2018 the average number of fires per year is 621. The highest number of fire incidents - 975 took place in 2002, and the least - 390 in 2010. The data has a declining trend.
The average number of yearly fire incidents per 10k residents in Salt Lake City, UT compared to nearest cities:
(Note: Based on data for the last 3 years, including only cities with population 5,000 and above)
| Salt Lake City: | 27.4 |
| South Salt Lake: | 44.9 |
| Millcreek: | 11.9 |
| East Millcreek: | 1.7 |
| North Salt Lake: | 22.8 |
| West Valley City: | 29.0 |
| Murray: | 32.0 |
| Taylorsville: | 20.8 |
| Holladay: | 19.9 |
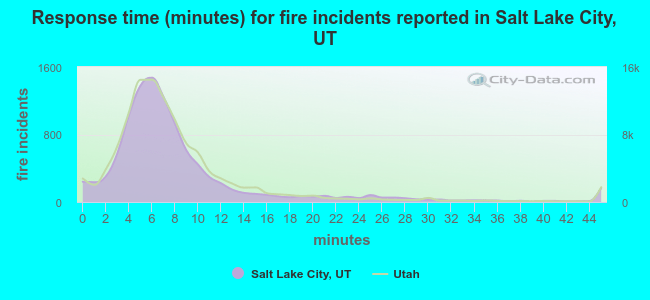 The median response time based on all reported fire incidents is 7 minutes. This is about the same as the Utah median value.
The median response time in Salt Lake City, UT compared to nearest cities:
(Note: Based on data for all years, including only cities with at least 500 fire incidents)
| Salt Lake City: | 7 minutes |
| South Salt Lake: | 6 minutes |
| West Valley City: | 6 minutes |
| Murray: | 6 minutes |
| Taylorsville: | 7 minutes |
| Holladay: | 7 minutes |
| Bountiful: | 5 minutes |
| Kearns: | 7 minutes |
| Midvale: | 6 minutes |
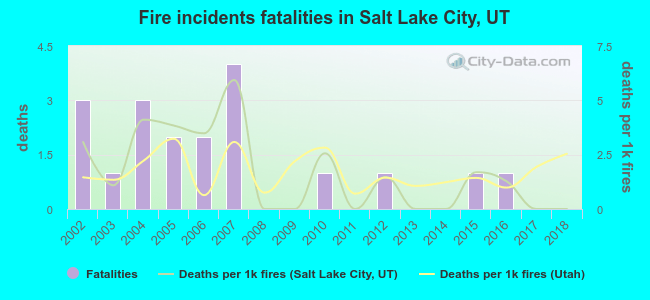 Based on the data from the years 2002 - 2018 the average number of fire-related fatalities per year is 1. The highest number of deaths - 4 took place in 2007, and the lowest - 0 in 2008. The data has a dropping trend.
The average number of deaths per 1,000 fire incidents is 2. This indicator was the highest - 6 in 2007, and the lowest 0 in 2008. The trend for fatalities per 1,000 incidents is declining. Compared to the state value the number of deaths per 1,000 fire incidents is similar.
Based on the data from the years 2002 - 2018 the average number of fire-related fatalities per year is 1. The highest number of deaths - 4 took place in 2007, and the lowest - 0 in 2008. The data has a dropping trend.
The average number of deaths per 1,000 fire incidents is 2. This indicator was the highest - 6 in 2007, and the lowest 0 in 2008. The trend for fatalities per 1,000 incidents is declining. Compared to the state value the number of deaths per 1,000 fire incidents is similar.Deaths per 1,000 incidents in Salt Lake City, UT compared to nearest cities:
(Note: Based on data for all years, including only cities with at least 2,500 fire incidents)
| Salt Lake City: | 1.8 |
| West Valley City: | 2.1 |
| Murray: | 0.8 |
| West Jordan: | 1.2 |
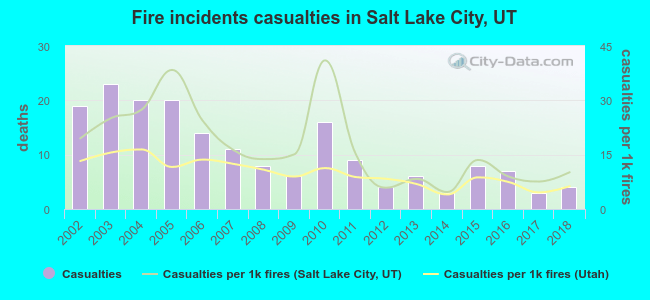 According to the data from the years 2002 - 2018 the average number of fire-related yearly casualties is 11. The highest number of reported injuries - 23 took place in 2003, and the lowest - 3 in 2014. The data has a decreasing trend.
The average number of casualties per 1,000 fires is 17. This indicator was the highest - 41 in 2010, and the lowest 5 in 2014. The trend for injuries per 1,000 incidents is declining. Compared to the state value the number of injuries per 1,000 fire incidents is higher.
According to the data from the years 2002 - 2018 the average number of fire-related yearly casualties is 11. The highest number of reported injuries - 23 took place in 2003, and the lowest - 3 in 2014. The data has a decreasing trend.
The average number of casualties per 1,000 fires is 17. This indicator was the highest - 41 in 2010, and the lowest 5 in 2014. The trend for injuries per 1,000 incidents is declining. Compared to the state value the number of injuries per 1,000 fire incidents is higher.Casualties per 1,000 incidents in Salt Lake City, UT compared to nearest cities:
(Note: Based on data for all years, including only cities with at least 500 fire incidents)
| Salt Lake City: | 17.1 |
| South Salt Lake: | 7.7 |
| West Valley City: | 25.5 |
| Murray: | 5.4 |
| Taylorsville: | 8.6 |
| Holladay: | 1.6 |
| Bountiful: | 31.3 |
| Kearns: | 13.4 |
| Midvale: | 13.4 |
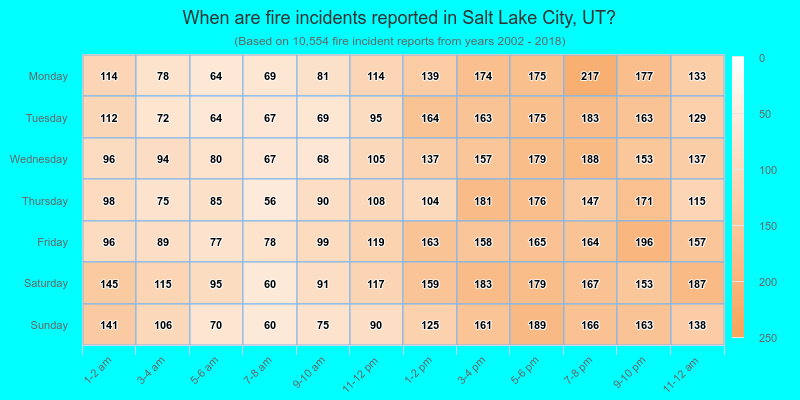
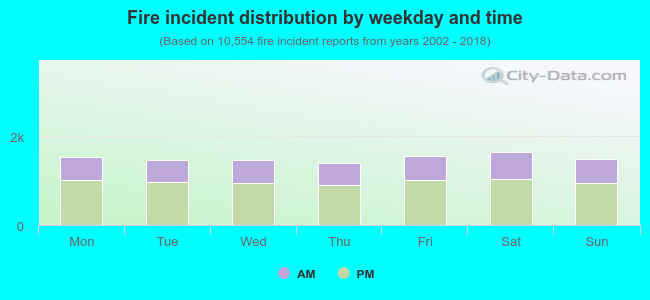 35.5% incidents where reported in the morning and 64.5% in the evening. The most fires (15.6%) took place on Saturday, and the least (13.3%) on Thursday.
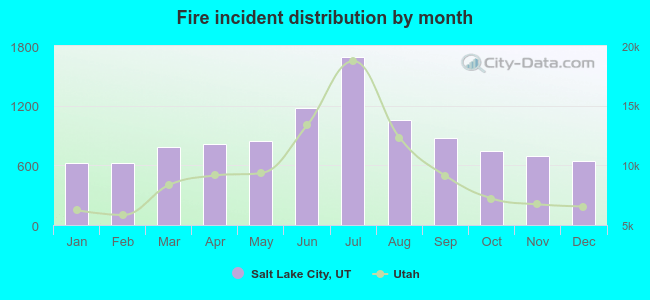 Based on the 10,554 fires from years 2002 - 2018 most fires (16.0%) took place during July, and the least (5.9%) in January.
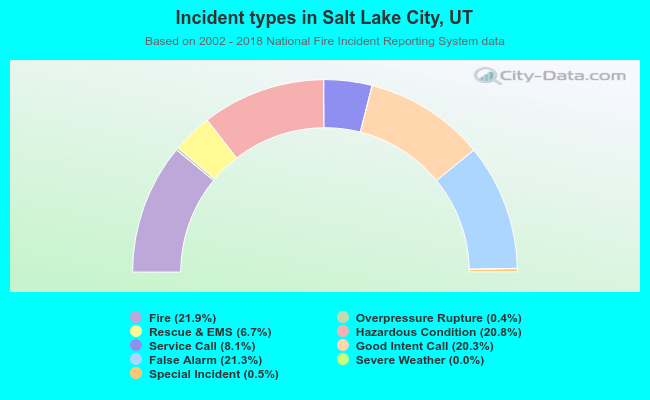 Out of all 48,116 cases reported during the years 2002 - 2018, the most belonged to the categories: Fire (21.9%), False Alarm (21.3%), and Hazardous Condition (20.8%).
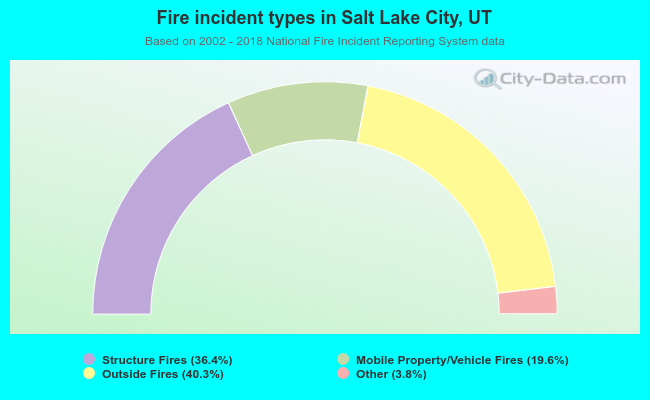 When looking into fire subcategories, the most reports belonged to: Outside Fires (40.3%), and Structure Fires (36.4%).