Sandusky: Fire Incidents, Ohio (OH)
Where are fire incidents reported in Sandusky, OH
Something went wrong! Please refresh the page.
| Fire incidents reported | |
|---|---|
| Sreet name | Count |
| MILAN RD | 346 |
| COLUMBUS AVE | 198 |
| PERRY ST | 186 |
| HAYES AVE | 184 |
| CLEVELAND RD | 174 |
| MONROE ST | 156 |
| PERKINS AVE | 146 |
| CAMP ST | 128 |
| ADAMS ST | 120 |
| CEDAR POINT DR | 120 |
| VENICE RD | 120 |
| FIRST ST | 114 |
| CAMPBELL ST | 110 |
| MARKET ST | 102 |
| TIFFIN AVE | 102 |
| WASHINGTON ST | 98 |
| MCDONOUGH ST | 74 |
| SHORELINE DR | 74 |
| SHOREWAY DR | 66 |
| HANCOCK ST | 64 |
| MILAN RD | 62 |
| FRANKLIN ST | 56 |
| REMINGTON AVE | 56 |
| WAYNE ST | 56 |
| WATER ST | 54 |
| FIFTH ST | 52 |
| JEFFERSON ST | 52 |
| LARCHMONT DR | 52 |
| PIERCE ST | 52 |
| CLINTON ST | 50 |
| Other | 454 |
2002 - 2018 National Fire Incident Reporting System (NFIRS) incidents
- Incident types reported to NFIRS in Sandusky, OH
- 3,67825.1%Fire
- 3,28222.4%Hazardous Condition
- 2,46716.8%Rescue & EMS
- 2,33315.9%False Alarm
- 1,86812.7%Service Call
- 9126.2%Good Intent Call
- 440.3%Overpressure Rupture
- 360.2%Severe Weather
- 360.2%Special Incident
- Fire incident types reported to NFIRS in Sandusky, OH
- 2,00454.5%Structure Fires
- 1,15331.3%Outside Fires
- 49813.5%Mobile Property/Vehicle Fires
- 230.6%Other
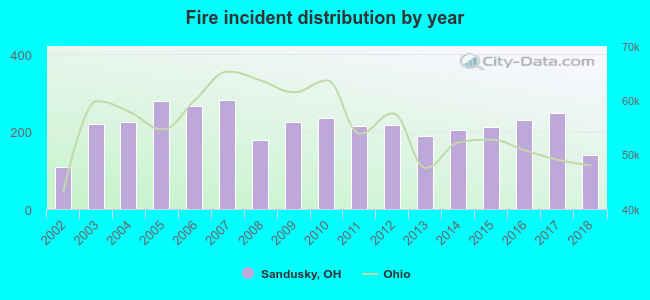 According to the data from the years 2002 - 2018 the average number of fire incidents per year is 216. The highest number of reported fire incidents - 281 took place in 2007, and the least - 108 in 2002. The data has an increasing trend.
The average number of yearly fire incidents per 10k residents in Sandusky, OH compared to nearest cities:
(Note: Based on data for the last 3 years, including only cities with population 5,000 and above)
| Sandusky: | 81.4 |
| Huron: | 36.4 |
| Port Clinton: | 97.6 |
| Bellevue: | 67.8 |
| Norwalk: | 39.5 |
| Clyde: | 56.5 |
| Vermilion: | 48.4 |
| Fremont: | 66.5 |
| Amherst: | 59.8 |
 The median response time based on all reported fire incidents is 4 minutes. This is lower than the Ohio median value.
The median response time in Sandusky, OH compared to nearest cities:
(Note: Based on data for all years, including only cities with at least 500 fire incidents)
| Sandusky: | 4 minutes |
| Huron: | 6 minutes |
| Port Clinton: | 8 minutes |
| Bellevue: | 6 minutes |
| Norwalk: | 4 minutes |
| Clyde: | 6 minutes |
| Vermilion: | 8 minutes |
| Fremont: | 4 minutes |
| Oak Harbor: | 8 minutes |
 Based on the data from the years 2002 - 2018 the average number of fire-related yearly casualties is 8. The highest number of reported casualties - 17 took place in 2004, and the lowest - 0 in 2014. The data has a growing trend.
The average number of injuries per 1,000 fire incidents is 34. This indicator was the highest - 76 in 2004, and the lowest 0 in 2014. The trend for casualties per 1,000 incidents is decreasing. Compared to the Ohio value the number of casualties per 1,000 fire incidents is much higher.
Based on the data from the years 2002 - 2018 the average number of fire-related yearly casualties is 8. The highest number of reported casualties - 17 took place in 2004, and the lowest - 0 in 2014. The data has a growing trend.
The average number of injuries per 1,000 fire incidents is 34. This indicator was the highest - 76 in 2004, and the lowest 0 in 2014. The trend for casualties per 1,000 incidents is decreasing. Compared to the Ohio value the number of casualties per 1,000 fire incidents is much higher.Casualties per 1,000 incidents in Sandusky, OH compared to nearest cities:
(Note: Based on data for all years, including only cities with at least 500 fire incidents)
| Sandusky: | 35.1 |
| Huron: | 27.3 |
| Port Clinton: | 15.2 |
| Bellevue: | 15.4 |
| Norwalk: | 13.7 |
| Clyde: | 14.0 |
| Vermilion: | 14.8 |
| Fremont: | 21.2 |
| Oak Harbor: | 2.3 |
 30.8% incidents where reported in the morning and 69.2% in the evening. The most fires (15.3%) took place on Sunday, and the least (13.4%) on Thursday.
 Based on the 3,678 incident reports from years 2002 - 2018 most fires (11.1%) took place during June, and the least (5.6%) in February.
 Out of all 14,656 cases reported during the years 2002 - 2018, the most belonged to the categories: Fire (25.1%), Hazardous Condition (22.4%), and Rescue & EMS (16.8%).
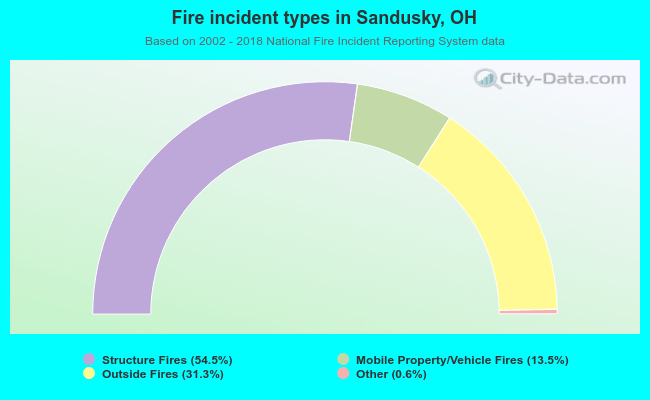 When looking into fire subcategories, the most incidents belonged to: Structure Fires (54.5%), and Outside Fires (31.3%).