Santa Maria: Fire Incidents, California (CA)
Where are fire incidents reported in Santa Maria, CA
Something went wrong! Please refresh the page.
| Fire incidents reported | |
|---|---|
| Sreet name | Count |
| BROADWAY | 696 |
| MAIN | 224 |
| HWY 101 | 158 |
| BETTERAVIA RD | 132 |
| BETTERAVIA | 114 |
| BLOSSER RD | 102 |
| COOK | 88 |
| DEPOT | 84 |
| LINCOLN | 84 |
| THORNBURG | 82 |
| BRADLEY RD | 80 |
| SKYWAY | 80 |
| BOONE | 72 |
| BRADLEY | 68 |
| MILLER | 68 |
| MORRISON | 66 |
| MORRISON AVE | 66 |
| BLOSSER | 64 |
| FESLER | 64 |
| ALVIN | 62 |
| WESTERN | 60 |
| CYPRESS | 58 |
| DONOVAN | 58 |
| ORANGE | 58 |
| CHURCH | 56 |
| MC CLELLAND | 56 |
| DONOVAN RD | 54 |
| BENWILEY | 50 |
| CHAPEL | 50 |
| BLACK RD | 48 |
| Other | 687 |
2005 - 2018 National Fire Incident Reporting System (NFIRS) incidents
- Incident types reported to NFIRS in Santa Maria, CA
- 27,65952.8%Rescue & EMS
- 10,82520.7%Good Intent Call
- 4,2618.1%Hazardous Condition
- 4,0577.7%Service Call
- 3,6897.0%Fire
- 1,7853.4%False Alarm
- Fire incident types reported to NFIRS in Santa Maria, CA
- 1,60343.5%Outside Fires
- 1,21132.8%Structure Fires
- 69418.8%Mobile Property/Vehicle Fires
- 1814.9%Other
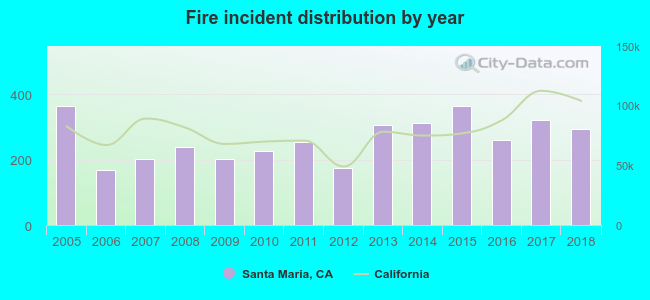 Based on the data from the years 2005 - 2018 the average number of fire incidents per year is 264. The highest number of reported fire incidents - 365 took place in 2015, and the least - 169 in 2006. The data has a dropping trend.
The average number of yearly fire incidents per 10k residents in Santa Maria, CA compared to nearest cities:
(Note: Based on data for the last 3 years, including only cities with population 5,000 and above)
| Santa Maria: | 28.3 |
| Orcutt: | 2.1 |
| Nipomo: | 18.1 |
| Guadalupe: | 29.8 |
| Oceano: | 3.7 |
| Arroyo Grande: | 3.5 |
| Grover Beach: | 0.7 |
| Pismo Beach: | 9.2 |
| Lompoc: | 43.0 |
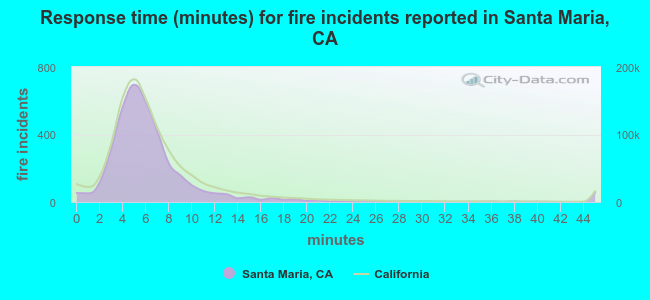 The median response time based on all reported fire incidents is 6 minutes. This is similar to the California median value.
The median response time in Santa Maria, CA compared to nearest cities:
(Note: Based on data for all years, including only cities with at least 500 fire incidents)
| Santa Maria: | 6 minutes |
| Mission Hills: | 5 minutes |
| Lompoc: | 5 minutes |
| San Luis Obispo: | 6 minutes |
| Isla Vista: | 6 minutes |
| Paso Robles: | 6 minutes |
| Goleta: | 7 minutes |
| Santa Barbara: | 5 minutes |
| Taft: | 6 minutes |
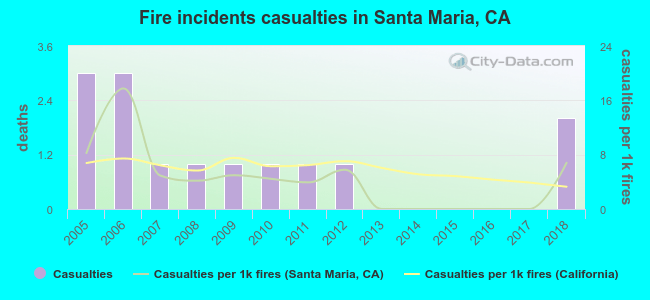 According to the reports from the years 2005 - 2018 the average number of fire-related yearly casualties is 1. The highest number of injuries - 3 took place in 2005, and the lowest - 0 in 2013. The data has a declining trend.
The average number of casualties per 1,000 fire incidents is 4. This indicator was the highest - 18 in 2006, and the lowest 0 in 2013. The trend for injuries per 1,000 fire incidents is dropping. Compared to the state value the number of casualties per 1,000 fires is lower.
According to the reports from the years 2005 - 2018 the average number of fire-related yearly casualties is 1. The highest number of injuries - 3 took place in 2005, and the lowest - 0 in 2013. The data has a declining trend.
The average number of casualties per 1,000 fire incidents is 4. This indicator was the highest - 18 in 2006, and the lowest 0 in 2013. The trend for injuries per 1,000 fire incidents is dropping. Compared to the state value the number of casualties per 1,000 fires is lower.Casualties per 1,000 incidents in Santa Maria, CA compared to nearest cities:
(Note: Based on data for all years, including only cities with at least 500 fire incidents)
| Santa Maria: | 3.8 |
| Mission Hills: | 10.3 |
| Lompoc: | 17.6 |
| San Luis Obispo: | 4.3 |
| Isla Vista: | 1.8 |
| Paso Robles: | 0.0 |
| Goleta: | 5.2 |
| Santa Barbara: | 4.8 |
| Taft: | 7.1 |
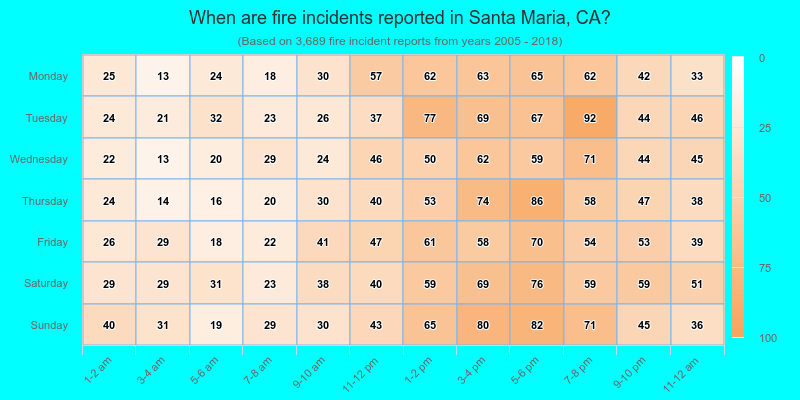
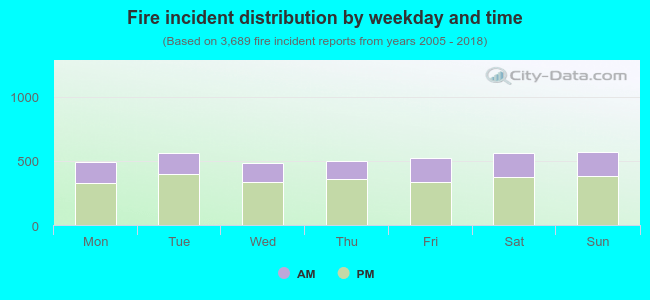 32.3% incidents where reported in the morning and 67.7% in the evening. The most fires (15.5%) took place on Sunday, and the least (13.1%) on Wednesday.
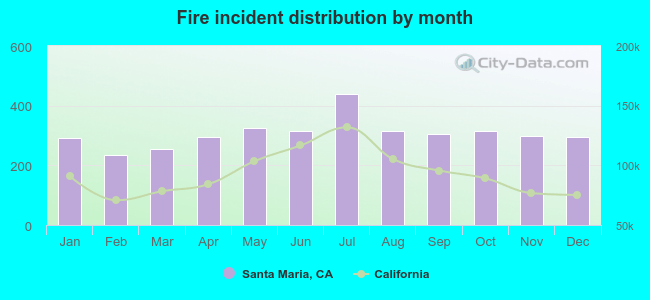 According to the 3,689 fires from years 2005 - 2018 most fires (11.9%) took place during July, and the least (6.4%) in February.
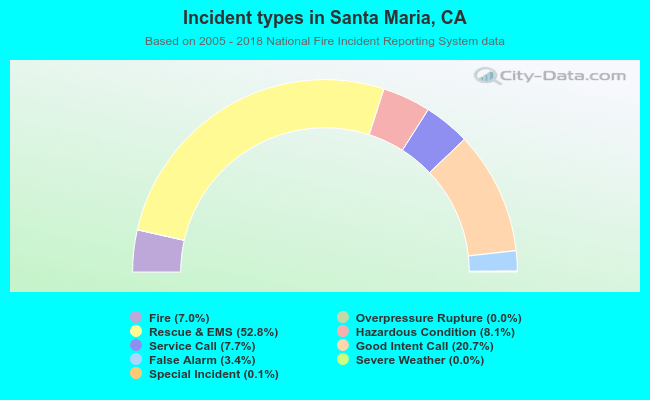 Out of all 52,352 cases reported during the years 2005 - 2018, the most belonged to the categories: Rescue & EMS (52.8%), Good Intent Call (20.7%), and Hazardous Condition (8.1%).
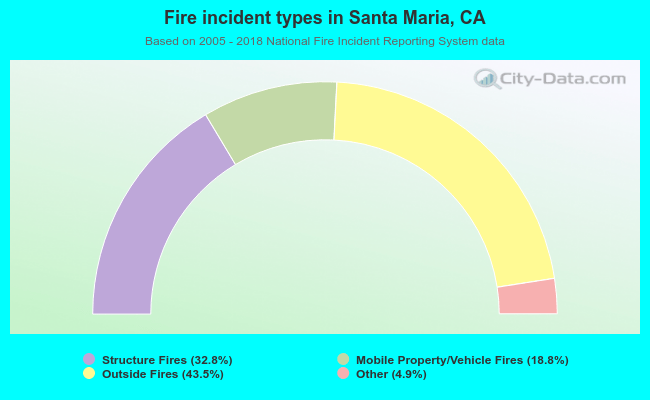 When looking into fire subcategories, the most reports belonged to: Outside Fires (43.5%), and Structure Fires (32.8%).