Saugus: Fire Incidents, Massachusetts (MA)
Where are fire incidents reported in Saugus, MA
Something went wrong! Please refresh the page.
| Fire incidents reported | |
|---|---|
| Sreet name | Count |
| BROADWAY | 1,038 |
| LINCOLN AVE | 168 |
| MAIN ST | 164 |
| WALNUT ST | 150 |
| SALEM TPKE | 136 |
| CENTRAL ST | 132 |
| ESSEX ST | 128 |
| TALBOT ST | 114 |
| HAMILTON ST | 106 |
| NEWHALL AVE | 94 |
| FOREST ST | 92 |
| RICE ST | 78 |
| LYNN FELLS | 76 |
| WARDEN ST | 64 |
| WHITNEY ST | 54 |
| LAUREL ST | 52 |
| FRANK BENNETT HWY | 48 |
| WINTER ST | 44 |
| MT VERNON ST | 42 |
| VINE ST | 40 |
| AUBURN ST | 38 |
| GOLDEN HILLS RD | 38 |
| DENVER ST | 34 |
| BALLARD ST | 32 |
| BRISTOW ST | 32 |
| HURD AVE | 32 |
| JUNIPER DR | 32 |
| SWEETWATER ST | 32 |
| WESTERN AVE | 32 |
| FOUNDERS WAY | 30 |
2002 - 2018 National Fire Incident Reporting System (NFIRS) incidents
- Incident types reported to NFIRS in Saugus, MA
- 11,05247.2%Rescue & EMS
- 3,09513.2%Hazardous Condition
- 2,68711.5%Fire
- 2,42610.4%False Alarm
- 2,0959.0%Good Intent Call
- 1,6897.2%Service Call
- 3091.3%Special Incident
- 360.2%Severe Weather
- Fire incident types reported to NFIRS in Saugus, MA
- 1,12541.9%Outside Fires
- 1,03638.6%Structure Fires
- 30311.3%Mobile Property/Vehicle Fires
- 2238.3%Other
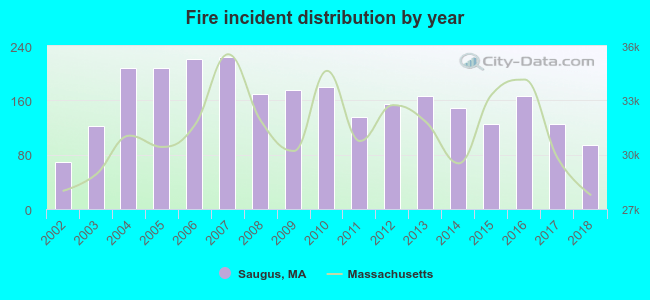 According to the data from the years 2002 - 2018 the average number of fires per year is 158. The highest number of fire incidents - 224 took place in 2007, and the least - 69 in 2002. The data has a rising trend.
The average number of yearly fire incidents per 10k residents in Saugus, MA compared to nearest cities:
(Note: Based on data for the last 3 years, including only cities with population 5,000 and above)
| Saugus: | 48.2 |
| Melrose: | 6.6 |
| Lynn: | 45.3 |
| Revere: | 68.1 |
| Malden: | 22.3 |
| Wakefield: | 21.3 |
| Everett: | 27.9 |
| Lynnfield: | 81.9 |
| Stoneham: | 58.2 |
 The median response time based on all reported fire incidents is 5 minutes. This is higher compared to the state median value.
The median response time in Saugus, MA compared to nearest cities:
(Note: Based on data for all years, including only cities with at least 500 fire incidents)
| Saugus: | 5 minutes |
| Lynn: | 4 minutes |
| Revere: | 3 minutes |
| Malden: | 3 minutes |
| Wakefield: | 2 minutes |
| Everett: | 2 minutes |
| Lynnfield: | 5 minutes |
| Stoneham: | 3 minutes |
| Chelsea: | 3 minutes |
 According to the reports from the years 2002 - 2018 the average number of fire-related casualties per year is 2. The highest number of reported injuries - 5 took place in 2002, and the lowest - 0 in 2007. The data has a declining trend.
The average number of injuries per 1,000 fire incidents is 14. This indicator was the highest - 72 in 2002, and the lowest 0 in 2007. The trend for casualties per 1,000 fire incidents is declining. Compared to the state value the number of casualties per 1,000 fires is about the same.
According to the reports from the years 2002 - 2018 the average number of fire-related casualties per year is 2. The highest number of reported injuries - 5 took place in 2002, and the lowest - 0 in 2007. The data has a declining trend.
The average number of injuries per 1,000 fire incidents is 14. This indicator was the highest - 72 in 2002, and the lowest 0 in 2007. The trend for casualties per 1,000 fire incidents is declining. Compared to the state value the number of casualties per 1,000 fires is about the same.
 27.9% incidents where reported in the morning and 72.1% in the evening. The most fires (16.4%) took place on Saturday, and the least (12.4%) on Wednesday.
 Based on the 2,687 fires from years 2002 - 2018 most fires (13.0%) took place during April, and the least (5.8%) in February.
 Out of all 23,402 cases reported during the years 2002 - 2018, the most belonged to the categories: Rescue & EMS (47.2%), Hazardous Condition (13.2%), and Fire (11.5%).
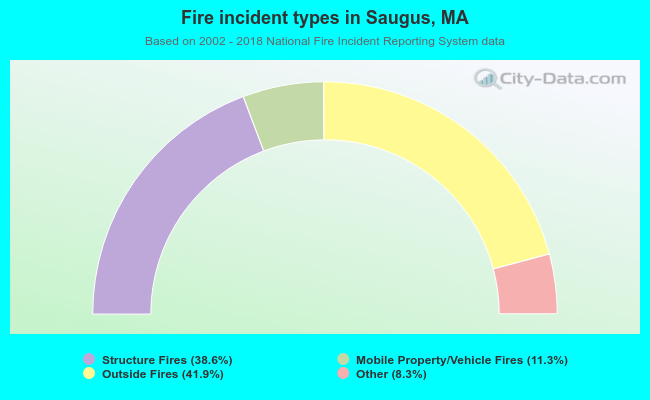 When looking into fire subcategories, the most reports belonged to: Outside Fires (41.9%), and Structure Fires (38.6%).