Sewaren: Fire Incidents, New Jersey (NJ)
Where are fire incidents reported in Sewaren, NJ
Something went wrong! Please refresh the page.
|
| |||||||||||||||||||||||||||||||||||||||||||||||||||||||||||||||||||||||||||||||||
2004 - 2018 National Fire Incident Reporting System (NFIRS) incidents
- Incident types reported to NFIRS in Sewaren, NJ
- 32249.6%Hazardous Condition
- 10015.4%Fire
- 9815.1%Good Intent Call
- 649.9%False Alarm
- 324.9%Service Call
- 233.5%Rescue & EMS
- 81.2%Severe Weather
- 20.3%Special Incident
- Fire incident types reported to NFIRS in Sewaren, NJ
- 4040.0%Outside Fires
- 3030.0%Structure Fires
- 2727.0%Mobile Property/Vehicle Fires
- 33.0%Other
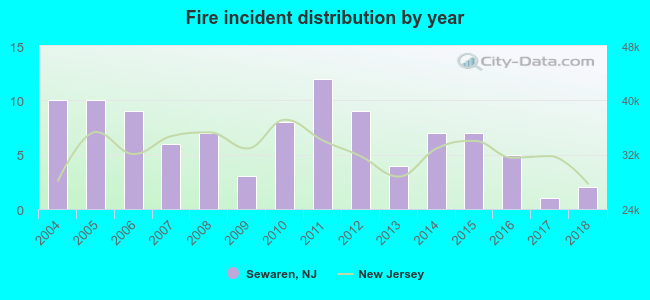 According to the data from the years 2004 - 2018 the average number of fires per year is 7. The highest number of reported fires - 12 took place in 2011, and the least - 1 in 2017. The data has a dropping trend.
 37.0% incidents where reported in the morning and 63.0% in the evening. The most fires (19.0%) took place on Sunday, and the least (9.0%) on Thursday.
 According to the 100 fires from years 2004 - 2018 most fires (16.0%) took place during August, and the least (3.0%) in February.
 Out of all 649 cases reported during the years 2004 - 2018, the most belonged to the categories: Rescue & EMS (49.6%), Fire (15.4%), and Service Call (15.1%).
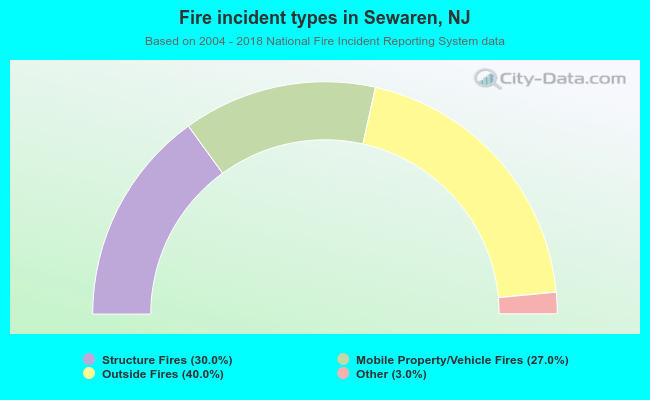 When looking into fire subcategories, the most incidents belonged to: Outside Fires (40.0%), and Structure Fires (30.0%).