| Fire incidents reported |
|---|
| Sreet name | Count |
|---|
| BROAD ST | 170 | | SHREWSBURY AVE | 38 | | SYCAMORE AVE | 26 | | NEWMAN SPRINGS RD | 20 | | WHITE ST | 16 | | MEADOW DR | 14 | | CRAWFORD ST | 10 | | PATTERSON AVE | 10 | | SICKLES PL | 10 | | MERIDIAN WAY | 8 | | TRAFFORD ST | 8 | | WILLIAMSBURG DR | 8 | | ADAMS WAY | 6 | | ELM LN | 6 | | GARDEN RD | 6 | | SPRUCE DR | 6 | | BARKER AVE | 4 | | BORDEN ST | 4 | | BUTTONWOOD DR | 4 | | EATONTOWN | 4 | | LITTLE SILVER | 4 | | ROBINSON PL | 4 | | ROUTE 35 | 4 | | SHREWSBURY PLAZA | 4 | | TINTON FALLS | 4 |
| | | Fire incidents reported |
|---|
| Sreet name | Count |
|---|
| WHITE RD | 4 | | AVE AT THE COMMON | 2 | | AVE AT THE COMMONS | 2 | | AVE AT THE COMMONS AVE | 2 | | AVE OF COMMON | 2 | | AVE OF COMMONS | 2 | | AVE OF THE CMNS | 2 | | AVE OF THE COMMONS | 2 | | AVENUE AT THE COMMONS | 2 | | AVENUE OF THE COMMONS AVE | 2 | | BEACHWOOD DR | 2 | | BIRCH DR | 2 | | BRADY RD | 2 | | COURT ST | 2 | | CRAWFORD AVE | 2 | | E NEMAND SPRINGS RD | 2 | | ELM LANE | 2 | | HERITAGE DR | 2 | | LAUREL DR | 2 | | MEWMAN SPRINGS RD | 2 | | NAVESINK RIVER | 2 | | NEWMAN RD | 2 | | NEWMAN SPGS RD | 2 | | OBRE PL | 2 | | PARKER PL | 2 |
|
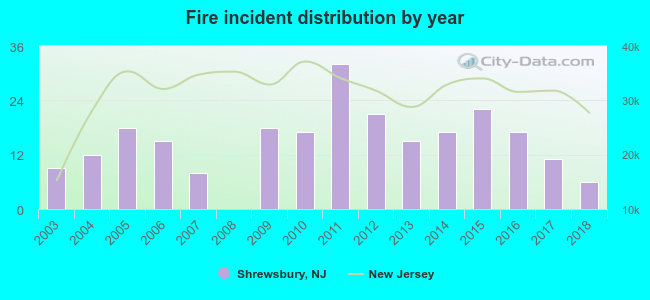 According to the data from the years 2003 - 2018 the average number of fires per year is 15. The highest number of reported fires - 32 took place in 2011, and the least - 0 in 2008. The data has a dropping trend.
 27.3% incidents where reported in the morning and 72.7% in the evening. The most fires (21.4%) took place on Friday, and the least (9.2%) on Tuesday.
 According to the 238 fires from years 2003 - 2018 most fires (14.7%) took place during June, and the least (4.2%) in January.
 Out of all 1,483 cases reported during the years 2003 - 2018, the most belonged to the categories: Rescue & EMS (45.3%), Good Intent Call (31.4%), and Fire (16.0%).
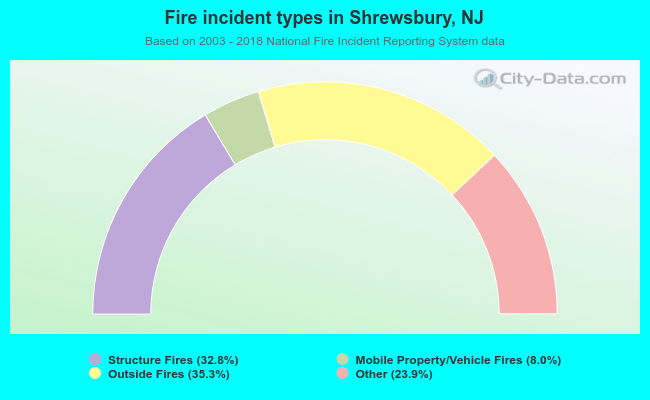 When looking into fire subcategories, the most incidents belonged to: Outside Fires (35.3%), and Structure Fires (32.8%).