Sierra Madre: Fire Incidents, California (CA)
Where are fire incidents reported in Sierra Madre, CA
Something went wrong! Please refresh the page.
|
| |||||||||||||||||||||||||||||||||||||||||||||||||||||||||||||||||||||||||||||||||||||||||||||||||||||||||||||
2005 - 2018 National Fire Incident Reporting System (NFIRS) incidents
- Incident types reported to NFIRS in Sierra Madre, CA
- 2,12060.4%Rescue & EMS
- 38911.1%Hazardous Condition
- 3329.5%Service Call
- 2366.7%Good Intent Call
- 2216.3%Fire
- 1985.6%False Alarm
- 80.2%Special Incident
- 60.2%Overpressure Rupture
- Fire incident types reported to NFIRS in Sierra Madre, CA
- 8839.8%Outside Fires
- 8036.2%Structure Fires
- 3214.5%Other
- 219.5%Mobile Property/Vehicle Fires
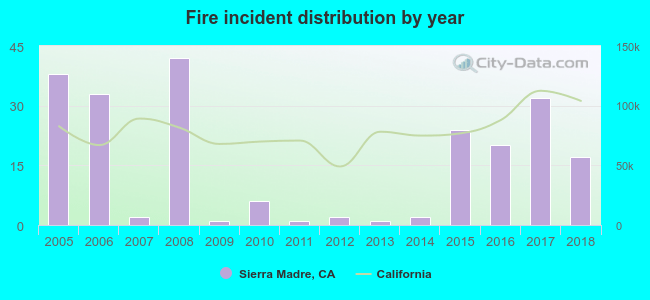 Based on the data from the years 2005 - 2018 the average number of fire incidents per year is 16. The highest number of reported fire incidents - 42 took place in 2008, and the least - 1 in 2009. The data has a declining trend.
The average number of yearly fire incidents per 10k residents in Sierra Madre, CA compared to nearest cities:
(Note: Based on data for the last 3 years, including only cities with population 5,000 and above)
| Sierra Madre: | 20.6 |
| Arcadia: | 12.9 |
| Monrovia: | 21.6 |
| East San Gabriel: | 1.7 |
| Temple City: | 7.8 |
| San Marino: | 11.7 |
| Pasadena: | 20.6 |
| Altadena: | 15.2 |
| Duarte: | 13.0 |
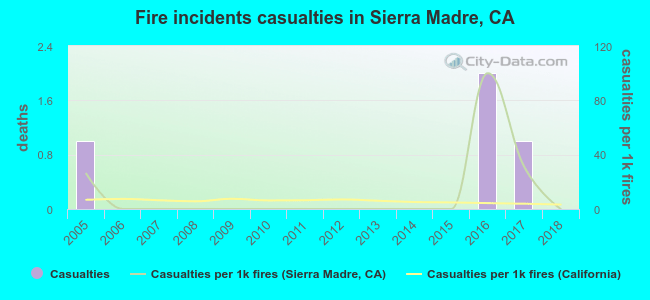 Based on the reports from the years 2005 - 2018 the average number of fire-related casualties per year is 0. The highest number of casualties - 2 took place in 2016, and the lowest - 0 in 2006. The data has a decreasing trend.
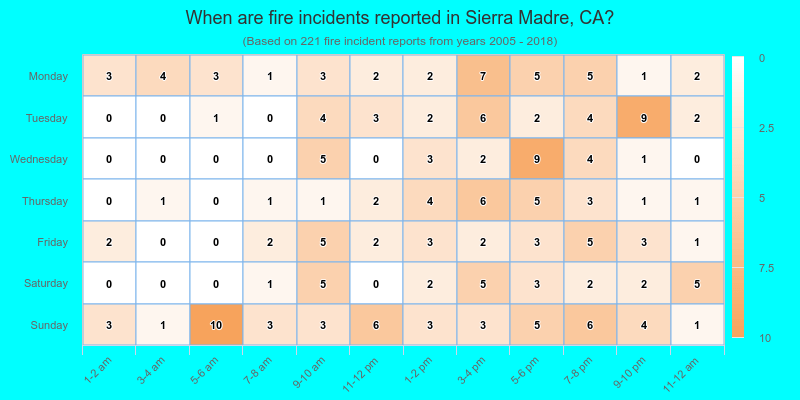
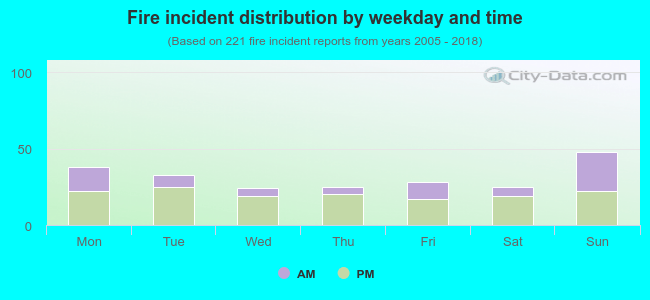 34.8% incidents where reported in the morning and 65.2% in the evening. The most fires (21.7%) took place on Sunday, and the least (10.9%) on Wednesday.
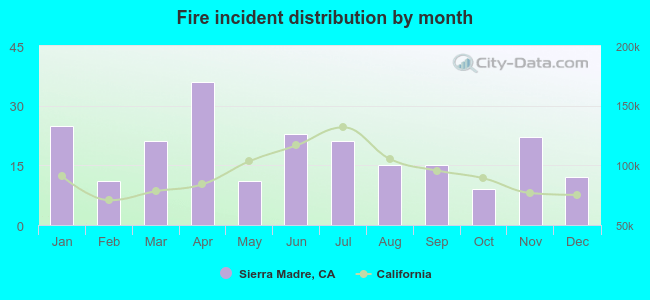 According to the 221 fire incident reports from years 2005 - 2018 most fires (16.3%) took place during April, and the least (4.1%) in October.
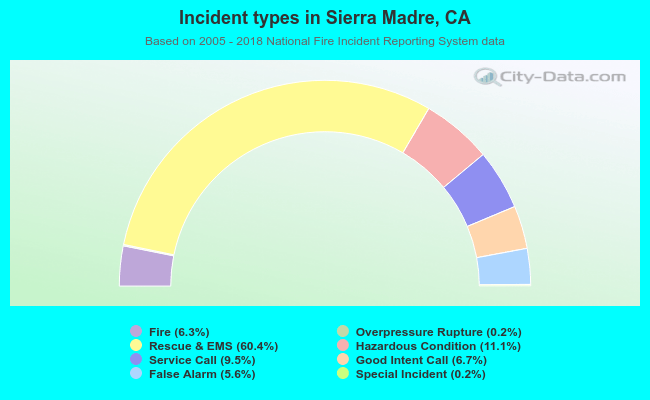 Out of all 3,510 cases reported during the years 2005 - 2018, the most belonged to the categories: Rescue & EMS (60.4%), Hazardous Condition (11.1%), and Service Call (9.5%).
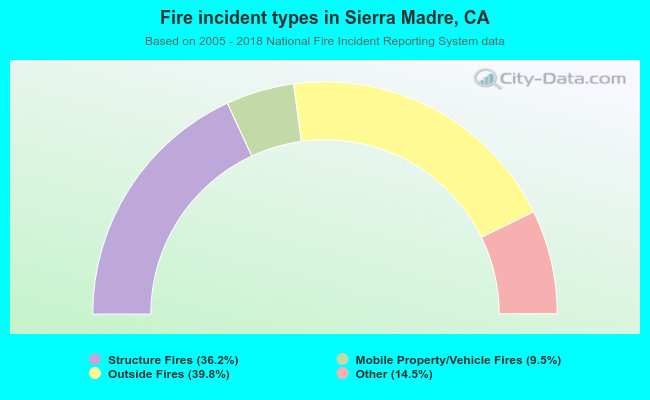 When looking into fire subcategories, the most incidents belonged to: Outside Fires (39.8%), and Structure Fires (36.2%).