Slidell: Fire Incidents, Louisiana (LA)
Where are fire incidents reported in Slidell, LA
Something went wrong! Please refresh the page.
| Fire incidents reported | |
|---|---|
| Sreet name | Count |
| GAUSE BLVD | 494 |
| PONTCHARTRAIN DR | 266 |
| HWY 190 | 236 |
| HWY 433 | 180 |
| I-10 | 150 |
| HWY 11 | 144 |
| HWY 90 | 134 |
| I10 | 124 |
| I-12 | 120 |
| OLD SPANISH TRL | 114 |
| BROWNSWITCH RD | 112 |
| I12 | 112 |
| NORTHSHORE BLVD | 110 |
| MILITARY RD | 108 |
| HOWZE BEACH RD | 98 |
| FRONT ST | 94 |
| ROBERT BLVD | 88 |
| CARR DR | 84 |
| LAURENT RD | 78 |
| AIRPORT RD | 76 |
| BROWNS VILLAGE RD | 74 |
| I-10 SERVICE RD | 72 |
| HIGHWAY 190 | 66 |
| LAKEVIEW DR | 62 |
| BAYOU LIBERTY RD | 54 |
| FREMAUX AVE | 54 |
| JAY ST | 54 |
| MAGNOLIA ST | 54 |
| 5TH ST | 52 |
| BLUEBIRD ST | 50 |
| Other | 3,585 |
2002 - 2018 National Fire Incident Reporting System (NFIRS) incidents
- Incident types reported to NFIRS in Slidell, LA
- 20,69348.8%Rescue & EMS
- 7,09916.8%Fire
- 5,45212.9%Good Intent Call
- 4,0029.4%Service Call
- 3,2657.7%Hazardous Condition
- 1,7454.1%False Alarm
- 430.1%Overpressure Rupture
- Fire incident types reported to NFIRS in Slidell, LA
- 4,02656.7%Outside Fires
- 1,68723.8%Structure Fires
- 1,25317.7%Mobile Property/Vehicle Fires
- 1331.9%Other
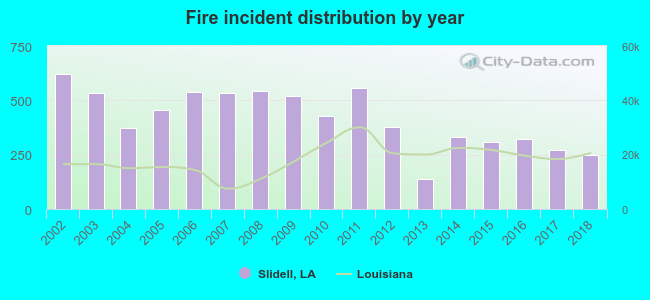 Based on the data from the years 2002 - 2018 the average number of fire incidents per year is 418. The highest number of reported fire incidents - 623 took place in 2002, and the least - 140 in 2013. The data has a decreasing trend.
The average number of yearly fire incidents per 10k residents in Slidell, LA compared to nearest cities:
(Note: Based on data for the last 3 years, including only cities with population 5,000 and above)
| Slidell: | 101.5 |
| Lacombe: | 89.9 |
| Mandeville: | 120.4 |
| Covington: | 252.3 |
| Chalmette: | 55.9 |
| Meraux: | 44.7 |
| New Orleans: | 17.3 |
| Gretna: | 38.5 |
| Terrytown: | 46.7 |
 The median response time based on all reported fire incidents is 6 minutes. This is close to the state median value.
The median response time in Slidell, LA compared to nearest cities:
(Note: Based on data for all years, including only cities with at least 500 fire incidents)
| Slidell: | 6 minutes |
| Pearl River: | 8 minutes |
| Lacombe: | 7 minutes |
| Mandeville: | 6 minutes |
| Covington: | 6 minutes |
| Madisonville: | 7 minutes |
| Chalmette: | 4 minutes |
| New Orleans: | 5 minutes |
| Violet: | 4 minutes |
 According to the reports from the years 2002 - 2018 the average number of fire-related fatalities per year is 1. The highest number of deaths - 4 took place in 2002, and the lowest - 0 in 2007. The data has a dropping trend.
The average number of fatalities per 1,000 fires is 2. This indicator was the highest - 8 in 2003, and the lowest 0 in 2007. The trend for fatalities per 1,000 fires is dropping. Compared to the state value the number of deaths per 1,000 incidents is similar.
According to the reports from the years 2002 - 2018 the average number of fire-related fatalities per year is 1. The highest number of deaths - 4 took place in 2002, and the lowest - 0 in 2007. The data has a dropping trend.
The average number of fatalities per 1,000 fires is 2. This indicator was the highest - 8 in 2003, and the lowest 0 in 2007. The trend for fatalities per 1,000 fires is dropping. Compared to the state value the number of deaths per 1,000 incidents is similar.Deaths per 1,000 incidents in Slidell, LA compared to nearest cities:
(Note: Based on data for all years, including only cities with at least 2,500 fire incidents)
| Slidell: | 1.8 |
| Mandeville: | 0.7 |
| Covington: | 2.3 |
| New Orleans: | 1.9 |
| Metairie: | 2.3 |
| Marrero: | 0.3 |
| Kenner: | 1.7 |
| Bogalusa: | 2.2 |
| Hammond: | 1.4 |
 According to the data from the years 2002 - 2018 the average number of fire-related yearly casualties is 3. The highest number of reported injuries - 10 took place in 2004, and the lowest - 0 in 2005. The data has a decreasing trend.
The average number of injuries per 1,000 fires is 6. This indicator was the highest - 27 in 2004, and the lowest 0 in 2005. The trend for injuries per 1,000 incidents is dropping. Compared to the state value the number of casualties per 1,000 fires is about the same.
According to the data from the years 2002 - 2018 the average number of fire-related yearly casualties is 3. The highest number of reported injuries - 10 took place in 2004, and the lowest - 0 in 2005. The data has a decreasing trend.
The average number of injuries per 1,000 fires is 6. This indicator was the highest - 27 in 2004, and the lowest 0 in 2005. The trend for injuries per 1,000 incidents is dropping. Compared to the state value the number of casualties per 1,000 fires is about the same.Casualties per 1,000 incidents in Slidell, LA compared to nearest cities:
(Note: Based on data for all years, including only cities with at least 500 fire incidents)
| Slidell: | 6.2 |
| Pearl River: | 3.2 |
| Lacombe: | 1.5 |
| Mandeville: | 7.5 |
| Covington: | 8.8 |
| Madisonville: | 0.0 |
| Chalmette: | 12.5 |
| New Orleans: | 3.7 |
| Violet: | 17.4 |
 27.7% incidents where reported in the morning and 72.3% in the evening. The most fires (16.0%) took place on Sunday, and the least (13.2%) on Tuesday.
 According to the 7,099 fire incident reports from years 2002 - 2018 most fires (10.5%) took place during March, and the least (6.0%) in September.
 Out of all 42,362 cases reported during the years 2002 - 2018, the most belonged to the categories: Rescue & EMS (48.8%), Fire (16.8%), and Good Intent Call (12.9%).
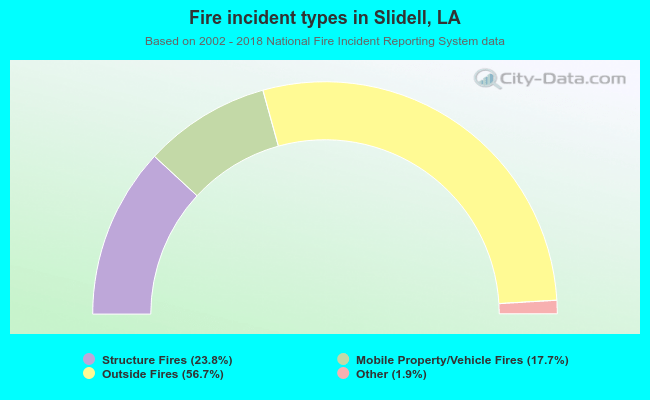 When looking into fire subcategories, the most incidents belonged to: Outside Fires (56.7%), and Structure Fires (23.8%).