Sloan: Fire Incidents, New York (NY)
Where are fire incidents reported in Sloan, NY
Something went wrong! Please refresh the page.
|
| |||||||||||||||||||||||||||||||||||||||||||||||||||||||||||||||||||||||||||||||||||||||||||||||||||||||||
2002 - 2018 National Fire Incident Reporting System (NFIRS) incidents
- Incident types reported to NFIRS in Sloan, NY
- 71362.4%Rescue & EMS
- 11410.0%Fire
- 1109.6%False Alarm
- 867.5%Hazardous Condition
- 544.7%Service Call
- 474.1%Good Intent Call
- 161.4%Severe Weather
- Fire incident types reported to NFIRS in Sloan, NY
- 6859.6%Outside Fires
- 3328.9%Structure Fires
- 108.8%Mobile Property/Vehicle Fires
- 32.6%Other
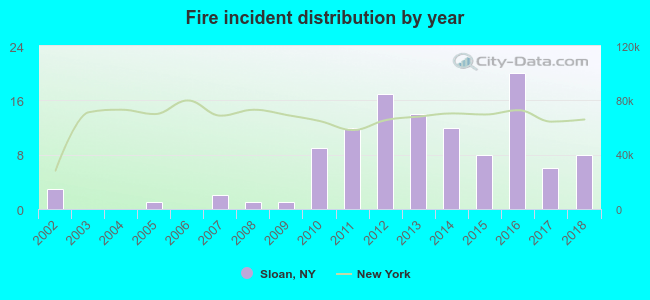 According to the data from the years 2002 - 2018 the average number of fires per year is 7. The highest number of fire incidents - 20 took place in 2016, and the least - 0 in 2003. The data has a growing trend.
 18.4% incidents where reported in the morning and 81.6% in the evening. The most fires (24.6%) took place on Saturday, and the least (6.1%) on Monday.
 Based on the 114 reports from years 2002 - 2018 most fires (14.9%) took place during April, and the least (3.5%) in February.
 Out of all 1,142 cases reported during the years 2002 - 2018, the most belonged to the categories: Rescue & EMS (62.4%), Fire (10.0%), and False Alarm (9.6%).
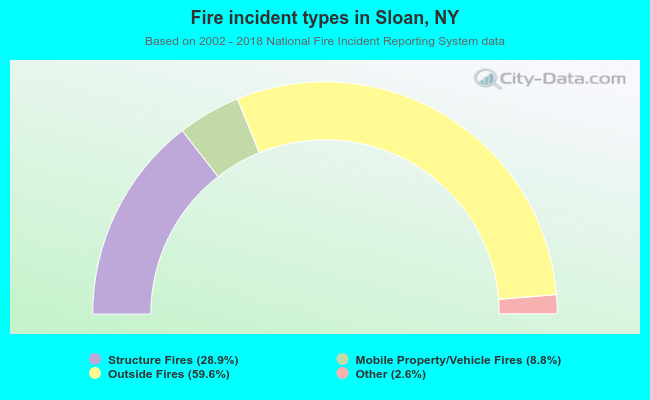 When looking into fire subcategories, the most incidents belonged to: Outside Fires (59.6%), and Structure Fires (28.9%).