Spring: Fire Incidents, Texas (TX)
Where are fire incidents reported in Spring, TX
Something went wrong! Please refresh the page.
| Fire incidents reported | |
|---|---|
| Sreet name | Count |
| INTERSTATE 45 FWY | 480 |
| CYPRESSWOOD DR | 440 |
| LOUETTA RD | 392 |
| RAYFORD RD | 328 |
| KUYKENDAHL RD | 306 |
| FM 2920 | 300 |
| SPRING CYPRESS RD | 268 |
| ALDINE WESTFIELD RD | 260 |
| NORTH FWY | 256 |
| HARDY RD | 214 |
| SAWDUST RD | 204 |
| SPRING STUEBNER RD | 204 |
| HIRSCHFIELD RD | 188 |
| TREASCHWIG RD | 164 |
| INTERSTATE 45 FEEDER HWY | 152 |
| GOSLING RD | 148 |
| RICHARDS RD | 144 |
| STUEBNER AIRLINE RD | 120 |
| RILEY FUZZEL RD | 110 |
| BOROUGH PARK DR | 102 |
| SPRING CYPRESS | 98 |
| NONE | 94 |
| NORTH FREEWAY | 88 |
| BUDDE RD | 86 |
| NORTH FRWY SB | 84 |
| NORTH FRWY NB | 82 |
| ELLA BLVD | 70 |
| FM 1960 | 68 |
| INTERSTATE 45 | 64 |
| PRUITT RD | 62 |
| Other | 5,154 |
2002 - 2018 National Fire Incident Reporting System (NFIRS) incidents
- Incident types reported to NFIRS in Spring, TX
- 28,43145.1%Rescue & EMS
- 10,73017.0%Fire
- 10,02615.9%Good Intent Call
- 7,32211.6%Hazardous Condition
- 3,9136.2%False Alarm
- 2,3963.8%Service Call
- 1130.2%Overpressure Rupture
- 910.1%Severe Weather
- Fire incident types reported to NFIRS in Spring, TX
- 4,76544.4%Outside Fires
- 4,02837.5%Structure Fires
- 1,56214.6%Mobile Property/Vehicle Fires
- 3753.5%Other
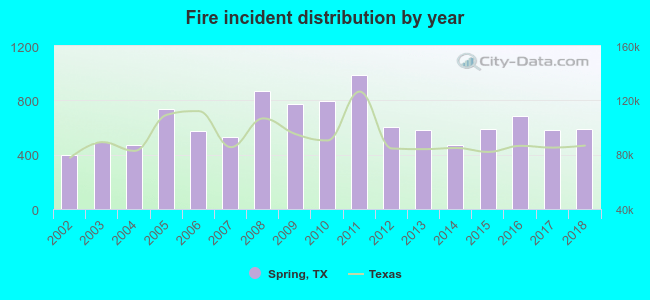 Based on the data from the years 2002 - 2018 the average number of fire incidents per year is 631. The highest number of reported fires - 988 took place in 2011, and the least - 401 in 2002. The data has a growing trend.
The average number of yearly fire incidents per 10k residents in Spring, TX compared to nearest cities:
(Note: Based on data for the last 3 years, including only cities with population 5,000 and above)
| Spring: | 113.9 |
| Humble: | 217.5 |
| Aldine: | 1.6 |
| The Woodlands: | 14.3 |
| Atascocita: | 1.4 |
| Tomball: | 209.2 |
| Jersey Village: | 29.9 |
| Conroe: | 106.3 |
| Houston: | 33.1 |
 The median response time based on all reported fire incidents is 7 minutes. This is comparable to the Texas median value.
The median response time in Spring, TX compared to nearest cities:
(Note: Based on data for all years, including only cities with at least 500 fire incidents)
| Spring: | 7 minutes |
| Humble: | 7 minutes |
| The Woodlands: | 6 minutes |
| Tomball: | 8 minutes |
| Splendora: | 10 minutes |
| Conroe: | 7 minutes |
| Houston: | 6 minutes |
| Crosby: | 11 minutes |
| Magnolia: | 9 minutes |
 According to the reports from the years 2002 - 2018 the average number of fire-related yearly deaths is 1. The highest number of deaths - 4 took place in 2015, and the lowest - 0 in 2002. The data has a growing trend.
The average number of deaths per 1,000 fire incidents is 2. This indicator was the highest - 7 in 2015, and the lowest 0 in 2002. The trend for fatalities per 1,000 fires is growing. Compared to the state value the number of deaths per 1,000 incidents is about the same.
According to the reports from the years 2002 - 2018 the average number of fire-related yearly deaths is 1. The highest number of deaths - 4 took place in 2015, and the lowest - 0 in 2002. The data has a growing trend.
The average number of deaths per 1,000 fire incidents is 2. This indicator was the highest - 7 in 2015, and the lowest 0 in 2002. The trend for fatalities per 1,000 fires is growing. Compared to the state value the number of deaths per 1,000 incidents is about the same.Deaths per 1,000 incidents in Spring, TX compared to nearest cities:
(Note: Based on data for all years, including only cities with at least 2,500 fire incidents)
| Spring: | 1.4 |
| Humble: | 2.0 |
| The Woodlands: | 1.1 |
| Tomball: | 3.3 |
| Conroe: | 2.9 |
| Houston: | 1.6 |
| Crosby: | 2.0 |
| Magnolia: | 1.4 |
| Channelview: | 3.8 |
 Based on the reports from the years 2002 - 2018 the average number of fire-related yearly casualties is 8. The highest number of casualties - 18 took place in 2014, and the lowest - 3 in 2005. The data has a declining trend.
The average number of casualties per 1,000 fire incidents is 13. This indicator was the highest - 38 in 2014, and the lowest 4 in 2005. The trend for injuries per 1,000 fire incidents is decreasing. Compared to the Texas value the number of injuries per 1,000 fire incidents is higher.
Based on the reports from the years 2002 - 2018 the average number of fire-related yearly casualties is 8. The highest number of casualties - 18 took place in 2014, and the lowest - 3 in 2005. The data has a declining trend.
The average number of casualties per 1,000 fire incidents is 13. This indicator was the highest - 38 in 2014, and the lowest 4 in 2005. The trend for injuries per 1,000 fire incidents is decreasing. Compared to the Texas value the number of injuries per 1,000 fire incidents is higher.
 29.8% incidents where reported in the morning and 70.2% in the evening. The most fires (15.9%) took place on Saturday, and the least (13.3%) on Wednesday.
 According to the 10,730 fires from years 2002 - 2018 most fires (10.1%) took place during January, and the least (7.1%) in February.
 Out of all 63,064 cases reported during the years 2002 - 2018, the most belonged to the categories: Rescue & EMS (45.1%), Fire (17.0%), and Good Intent Call (15.9%).
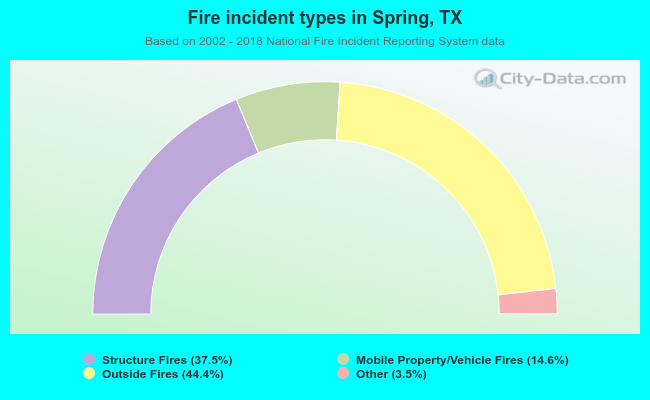 When looking into fire subcategories, the most incidents belonged to: Outside Fires (44.4%), and Structure Fires (37.5%).